
Chapter 7
Chapter 7. 1. (a) (b) P (X=0) = 0.1 (c) P (1 < X ≤ 3) = 0.2 (d) µ = 3 (e) 0.1 (f) 0.2 (g) Discrete 2. B. Chapter 7. 3. (a) (b) µ = $ 2 (c) $ 3 - $ 2 = $ 1. Chapter 8. 4.(a) Geometric X: Number of cards drawn until the 1 st Jack n: unknown P (Jack) = 1/13 Independent

Chapter 7
E N D
Presentation Transcript
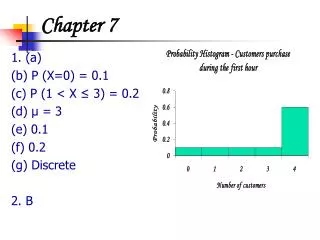
Chapter 7 1. (a) (b) P (X=0) = 0.1 (c) P (1 < X ≤ 3) = 0.2 (d) µ = 3 (e) 0.1 (f) 0.2 (g) Discrete 2. B
Chapter 7 3. (a) (b) µ = $ 2 (c) $ 3 - $ 2 = $ 1
Chapter 8 4.(a) Geometric X: Number of cards drawn until the 1st Jack n: unknown P (Jack) = 1/13 Independent (b) Binomial X: success-shipped on time; failure-shipped late n: 100 P (on time) 90% Independent 5. A 6. σ = 1.2649
Chapter 8 7. (a) Binomial X: success - defective; failure- not defective n: 20 toasters P (defective) = 0.02 Independent (b) P (X=1) = 0.272 (c) P (X ≤ 2) = 0.9927 (d) µ = 0.4 σ = 0.626 8. C 9. (a) Geometric X: Number of generating until the first 0 n: unknown P (0) = 1/10 Independent (b) P (X = 5) = 0.0565 (c) µ = 10
Chapter 9 10. Parameter: P=37%, Statistic: = 41% 11. C 12. (a) C, most data are unequal to parameter (b) A, data have least spread. (c) A, larger samples have less spread (variability) (d) A has least bias and variability.
Chapter 9 13. (a) µ = 20%, σ = 0.03 (b) np = 50 > 10, n (1-p) = 200 > 10 (c) P(X ≥ 60) = 0.09 14. (a) n = 1, P (X < 5.5) = 0.05 (b) n =3, P (X < 5.5) = 0.003
Chapter 10 15. (a) Z* = 2.33 (b) (c) (d) As confidence levels increase, margins of error increase too. 105 ± 11.65 (93.35, 116.05) 1% 98% 1% 93.35 105 116.05 105 ± 8.2 (96.8, 113.4) 5% 90% 5% 96.8 105 113.2
Chapter 10 16. (a) Ho: µ = 110 (same food expenses like national average) Ha: µ < 110 (Grocery food are lower than national average) SD = 1.77 Z = - 2.82 normalcdf (-e99, - 2.82) = 0.002 • P < α (0.05), Reject Ho. The households spend less on food than national average (b) Type I error P(α) = 0.05, chance to falsely reject Ho (c) Type II error, chance to falsely accept Ho
Chapter 10 (a) Ho: µ = 1 (Loaves of bread meet standard) Ha: µ≠ 1 (Loaves of bread don’t meet standard) (b) µ = 1, σ = 0.03, (c) Z = 1.67, normalcdf (1.67, e99) = 0.05 x 2 = 0.10 (d) P-value (0.1) > α (0.05), accept Ho, The weights of loaves of bread meet the standard. (e) 18. C α = 2.5%α = 2.5% P = 0.05SD = 0.02 P = 0.05 µ = 1
Chapter 11-12 19. SE = 0.32 20. (a) (b) Ho: µ = 28 (Deformity is not less than 28) Ha: µ < 28 (Deformity is less than 28) SE = 1.21, T = - 2.13, tcdf (- e99, - 2.13, 37) = 0.02 P-value (0.02) < α (0.05), reject Ho, The deformity is less than the expected value 28. (c) 25.42 ± 2.38 (23.04, 27.8) 2.5% 95% 2.5% 23.04 25.42 27.8 α = 5% P = 0.02SE = 1.21 µ = 28
Chapter 11-12 21. C 22. (a) Ho: µ1= µ2 (Fund and EAFE have the same return) Ha: µ1> µ2 (Fund has higher return than EAFE) (b) (c) SE = 7.08 (d) T = 0.12, tcdf (0.12, e99, 18) = 0.45 (e) P-value (0.45) > α (0.05), accept Ho, Fund and EAFE have the same return
Chapter 11-12 23. B 24. (a) (b) Ho: µ = 50% (50% or less of people like brand A) Ha: µ > 50% (More than 50% of people like brand A) SD = 0.07, Z= 1.71, notmcdf (1.71, e99) = 0.04 P-value (0.04) < α (0.05), reject Ho, More than 50% of people prefer brand A (c) 62% ± 14% (48%, 76%) 2.5% 95% 2.5% 48% 62% 76% α = 5% SE = 0.07 P = 0.04 P = 50%


