Download
1 / 12
120 likes | 244 Vues
Methyl Mercury Concentrations and Loads in the Delta http://mercury.mlml.calstate.edu/links/. Mark Stephenson, Chris Foe, Gary Gill, and Wes Heim Central Valley Regional Water Quality Control Board and Department of Fish and Game. Outline. Background Study Design

E N D
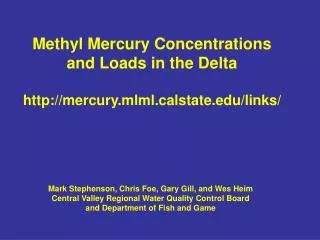
Methyl Mercury Concentrations and Loads in the Deltahttp://mercury.mlml.calstate.edu/links/ Mark Stephenson, Chris Foe, Gary Gill, and Wes Heim Central Valley Regional Water Quality Control Board and Department of Fish and Game
Outline • Background • Study Design • Methyl Mercury Concentrations • Sources • Biomagnification • Sinks • Methyl Mercury Loads • Losses • Seasonal Box Models • Conclusions
Methyl Mercury Concentrations in primary Delta water sources.
Methyl mercury concentrations in juvenile silverside fish and in water in the San Joaquin River at Vernalis. The silverside data are from Slotton et al. (2008)
Predicted and observed methyl mercury concentrations at Mallard Island
Outline • Background • Study Design • Methyl Mercury Concentrations • Sources • Biomagnification • Sinks • Methyl Mercury Loads • Losses • Seasonal Box Models • Conclusions
Ratio of the sum of monthly methyl mercury export loads divided by the sum of incoming loads as a function of tributary inflow. The five squares represent dates when the Yolo Bypass and/or San Joaquin River were flooding. These five data were not included in the regression.
A (A) Methyl mercury mass balance for the Delta in January 2005. (B) Same mass balance for August 2005. Note changes in the relative magnitude of the various processes B
Conclusions • Methyl mercury concentrations were measured in all major water inputs and exports to Delta for 45 months. • Tributary inputs were the major source of methyl mercury. • Positive correlations between methyl mercury concentrations in water and in juvenile silverside fish during an upstream flooding event in the San Joaquin River shows small fish can capture pulses of methyl mercury. These results are similar to those showing correlations between large fish and methyl mercury concentrations
Conclusions • The Delta is a net methyl mercury sink. The loss of methyl mercury is an inverse function of net Delta inflow. • Box models demonstrate that Central Valley rivers are the major sources of methyl mercury to the Delta. Particle settling and exports to southern California and to San Francisco Bay are the major sinks in winter while photo degradation and exports to southern California are major sinks in summer.
Conclusions • Given input MMHg concentrations we can predict export concentrations • With the particle tracking model we can predict flow patterns between inputs and exports, the losses that occur in those flow paths, the processes responsible and where in the flow paths the losses occur.