Download
1 / 8
80 likes | 196 Vues
This study analyzes the structure of freight data collection pertinent to Washington State's potato production and diesel distribution. Using USDA data and insights from the State Potato Commission, the research identifies key supply chains and freight transportation modes, including rail, truck, and local distribution. It discusses the roles of various regulatory agencies, such as the Washington Department of Ecology and the U.S. EPA, in monitoring fuel distribution. The study aims to improve the understanding of local freight flows and promote efficient distribution networks across the state.

E N D
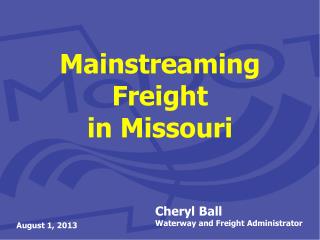
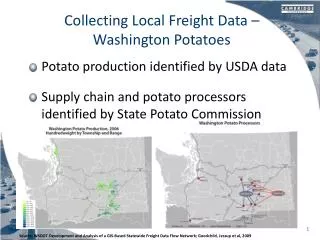
Collecting Local Freight Data – Washington Potatoes • Potato production identified by USDA data • Supply chain and potato processors identified by State Potato Commission Source: WSDOT Development and Analysis of a GIS-Based Statewide Freight Data Flow Network; Goodchild, Jessup et al, 2009
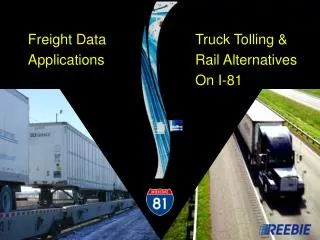
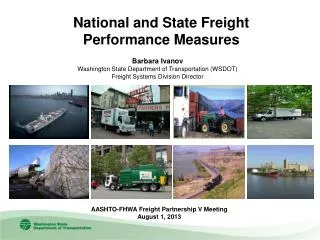
Collecting Local Freight Data – Diesel Distribution • Sources of diesel data • WA DOA – regulates fuel at gas stations • WA Department of Ecology – regulates active underground storage tanks • U.S. EPA – regulates above-ground storage tanks • WA DOR – responsible for assessing and collecting fuel taxes at terminal locations • Other agencies monitor mode-specific activity (e.g., pipeline, waterborne activity, railroads) Source: WSDOT Development and Analysis of a GIS-Based Statewide Freight Data Flow Network; Goodchild, Jessup et al, 2009
Collecting Local Freight Data – Diesel Distribution (continued) Source: WSDOT Development and Analysis of a GIS-Based Statewide Freight Data Flow Network; Goodchild, Jessup et al, 2009
Development of Generic Supply Chain Descriptions • Identify commodities that represent high volume and high value • Identify industries and commodities where disaggregation have been problematic • Based on literature review • Identify industries and commodities where CFS data are weak
Development of Generic Supply Chain Descriptions (continued) • Propose to identify five supply chains total • Potential candidates include • Containerized imports of retail consumer products • Bulk domestic products (e.g. agricultural products) • LTL shipments of mixed manufactured products • Domestic plastics and rubber manufacturing • Building and/or road construction • Parcel and mail shipped commodities
Transportation and shipment size: to D/C is rail carload and truckload; to stores are truckload; local vendors are small local peddle trucks Distribution: Demand pull from point of sale data. Finished goods are nationwide; regional D/Cs are local Food Processors’Plants and D/Cs Supermarket’s Facilities FinishedGoods RegionalD/C Stores Consumers LocalVendors Supply Chain Example: Supermarket
Transportation and shipment size: to site and yards are truck of various sizes Distribution: Timely sequencing/staging is key. Materials to be installed are national; supplies and equipment for use in erection of facility are regional/local Distributors Construction Site Short-Term Inventory;Materials To Be Erected Inventoryfor Site ErectedFacility Equipment,Forms, Trucks,etc. ConstructionSupplies, Tools Contractor’s Yard TemporaryYard; Near Site Example: Construction
Transportation and shipment size: to warehouse, distributor, D/Cs, supermarkets’ D/Cs is rail carload and truckload Distribution: Slow, predictable. Finished goods are nationwide; D/Cs are regional Growers Processing Plant Distributor HarvestSlaughterShip Can, Dress, Freeze, Protect,Inventory Inventory Supermarkets’Regional D/C Flow Thru;Consolidations Inventory Inventory Warehouseat Origin Regional D/Cs Example: Food Processing and Distribution