Download
1 / 11
110 likes | 290 Vues
An idiot’s guide to writing methods of collecting data! 9 Marks. Why is there a need for coastal management along the North Norfolk Coastline/Isle of Purbeck ? ?. Methods of collecting data: Methodology .

E N D
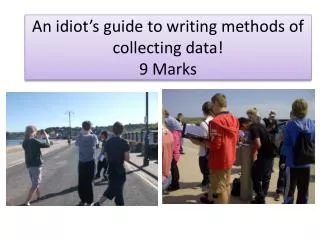
An idiot’s guide to writing methods of collecting data!9 Marks
Why is there a need for coastal management along the North Norfolk Coastline/Isle of Purbeck?? Methods of collecting data: Methodology • In this section you have to explain the methods that you used to collect your data. It must include the following: • Type of data: Primary /Secondary and links to key questions • Risk assessment • Method used: Name, Explanation of method & Equipment (what was done and why it was done that way) • Justification/purpose of method (why you did the techniques) • Evaluation (why is was a good/relevant technique and hint at problems/limitations – this is completed in high control leave column blank for now!) • Annotated pictures as evidence of you (friends) collecting data and use of equipment. • GISidentifying where methods were collected/used
In this section I will refer to as the ‘methods of collecting data’ and it will be presented in a techniques grid. I have used location maps where best indicating where the data was collected.
Types of data • Primary data- data which is collected first hand during fieldwork. For example..... • Secondary data- data collected by others for a purpose. It can be used to support primary data for example......
Risk assessment • Likely risks that could be encountered during data collection: • Weather • Inappropriate footwear • Injuries sustained during field work • Being separated from a group • Rock falls • Hazards associated with water • How can these be minimised and level of risk (low/med/high)
Sampling Why sample? It is not possible to survey all of the three areas so a sample needs to be taken in order to provide a representation. Sampling techniques used Stratified – Systematic -
Justification provided. Clear description of the method carried out. Linking back to the task question. Underlined points show evaluation of the method. This explains why the methods were done in the way they were.
Fig :Maps showing the location of study area and three sites Site 2 Site 1 Car Tax survey in the car park Fieldsketching of Lulworth Questionnaires by the visitor centre Fieldsketching of Stair hole and discussion of new management strategies. Maps to show where data was collected Source for both photographs: http://www.bing.com/maps/
Sketches/ annotated photographs to show how data was collected