Download
1 / 46
460 likes | 509 Vues
Learn about the significance of geological maps in civil engineering, geology studies, and mineral exploitation. Understand contour maps, contour lines, benchmarks, and their role in representing land features accurately.

E N D
Engineering Geology Topographic Maps • Hussienaldeeky
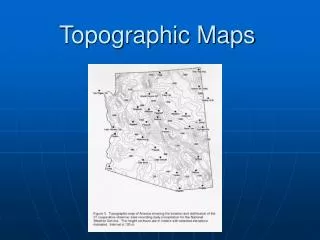
Maps are a two dimensional representation, of an area or region. There are many types of maps, each with a specific function. As an example: Bathymetric maps, illustrate the topography of the ocean floor topographic maps show the topography of the earth’s surface above sea level. Street maps show the locations of streets, highways and roads. Demographic maps: used to show statistical changes in a population (age, race, education, etc) for a specific region. geologic maps: shows the distribution of various types of bedrock in an area maps may vary in content, scale, and size, they all have several things in common: publishing information (title, the author of the map, year printed), the contour interval, the scale of the map, a North indicator, and a legend stating what each of the symbols and lines on the map represent
A geologic map involves three levels of information: 1. The information that any map needs to function as a scale model of the world, including A scale : compares distances on the map with distances on earth. An indication of the location in the real world that it represents. Representations of roads, bodies of water, buildings, etc. 2. Information about the surface topography of the mapped region: Topographic counter lines 3. Information about the bedrock: The identity of the rocks The orientation of strata The presence of structures such as faults, folds, domes, and basins
What is a geological map used for? a geological map is to indicate the nature of the near-surface bedrock. This is of great importance to : • civil engineers who, for example, have to advise on the excavation of road cuttings or • geographers studying the use of land • companies exploiting minerals
contour map: consists of lines . Each of these lines, called contour line, which is a line along which some quantity (temperature, for example) is everywhere the same. Contour lines bear more specific names depending on what quantity the contour map shows: Each contour line has a value associated with it and is usually labeled with that value. Contour maps show contour lines with values at regular intervals, including some standard reference value. The contour interval is arbitrary but should be chosen so that the contour map shows enough contours to reveal the pattern clearly without being crowded with too many contour lines contour map should always include a title or caption that identifies the quantity shown and the contour interval used.
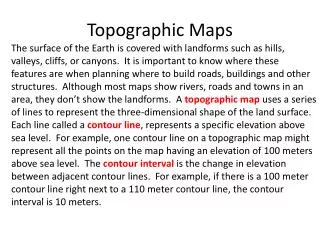
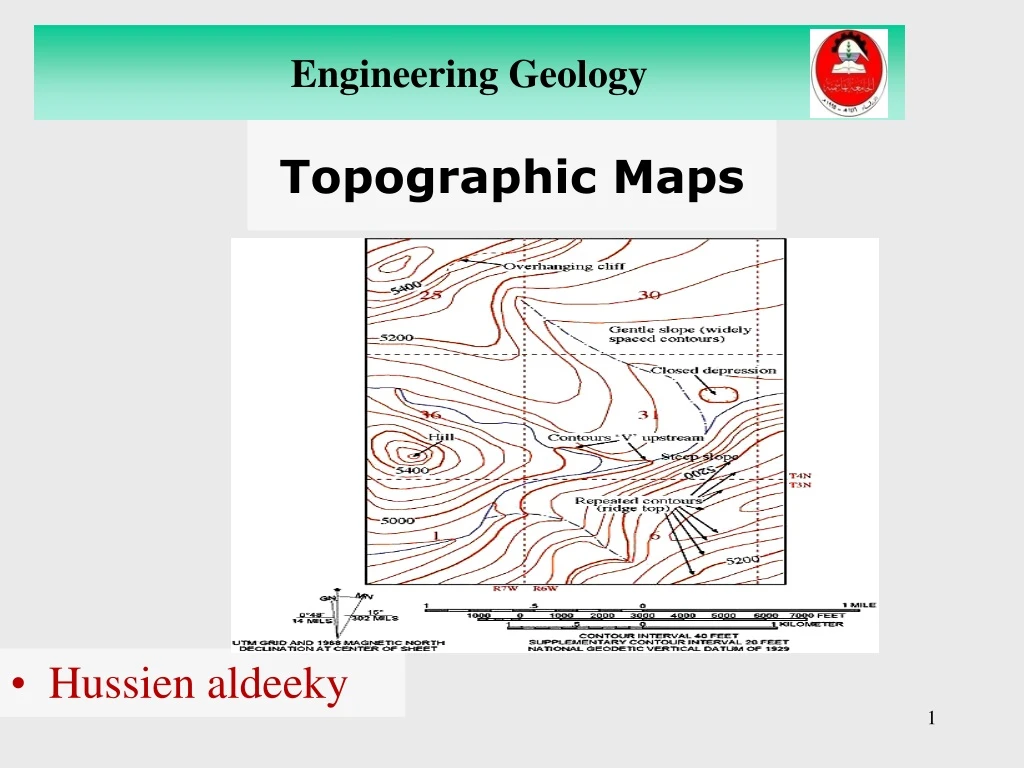
Engineering Geology topographic map A topographic map, also known as a contour map, is a map that shows the shape of the land using contour line. It is a map that shows and elevation field, meaning how high and low the ground is in relation to sea level.
Engineering Geology Contour lines Contour lines are lines that connect points that are of the same elevation. They show the exact elevation, the shape of the land, and the steepness of the land’s slope. Contour lines never touch or cross
Contour lines are generally drawn as black or brown lines on a map. Usually, every 5th contour is printed with heavier print than the others and is labeled with the elevation of the contour above sea level it is called an index contour line.
Engineering Geology A benchmark • A benchmark is a point where exact elevation is known and is marked with a brass or aluminum plate. It is marked BM on the map with the elevation numbers given in feet. • Benchmarks are useful to help determine contour lines. Map scale – compares distances on the map with distances on earth. Legend – explains symbols used on the map. Index contours – contour lines that are labeled to help you find the contour interval.
Engineering Geology A contour interval A contour interval is the difference in elevation between two contour lines that are side by side. Remember that a contour interval is not the distance between the two lines – to get the distance you need to use the map scale.
Engineering Geology Understanding Topographic Maps . Cartographers solve the problem of representing the three-dimensional land surface on a flat piece of paper by using contour lines, thus horizontal distances and vertical elevations can both be measured from a topographic map.
Engineering Geology Local Topographic Map
Engineering Geology Aerial Photo
Engineering Geology Topographic Quadrangles Quadrangles are sections of the Earth that are bounded by lines of Latitude at the top (north) and bottom (south) Longitude on the right (east) and left (west) . Longitude and latitude are measured in degrees, minutes and seconds. 1 degree (o) = 60 minutes (‘) 1 minute = 60 seconds (“)
Engineering Geology Compass Bearing A bearing is the direction from one point to another. If direction is expressed in degrees east or west of north, it is called a “quadrant bearing.” If direction is expressed in degrees between 0 and 360, it is called “azimuth bearing.” . What is the bearing from C to D? N22oE
Engineering Geology Azimuth Bearing What is the bearing from A to B? N45o
Engineering Geology THEMOHO Map Scale Map Scale: Maps come in a variety of scales, covering areas ranging from the entire earth to a city block (or less).
Engineering Geology Vertical Scale (contour interval): All maps have a horizontal scale. Topographic maps also have a vertical scale to allow the determination of a point in three dimensional space. • Contour Lines: Contour lines are used to determine elevations and are lines on a map that are produced from connecting points of equal elevation (elevation refers to height in feet, or meters, above sea level).
Engineering Geology Rules for Contour Lines
Engineering Geology THE MANTLE Contour Lines on Ridges and Valleys
Engineering Geology THE CORE Contour Lines on Closed Depressions
Engineering Geology Contour Interval TheContour Interval(CI) is the difference in elevation between two adjacent contour lines. The CI can vary from map to map. Usually expressed in feet or meters. Elevation is always referenced to Mean Sea Level (MSL). MSL=0 Map Scale Several representations of scale exist: Verbal: “one inch equals one mile” Ratio: 1:24,000 means that the portion of the earth represented has been reduced to 1/24000th its actual size. Graphic:
Engineering Geology Change in elevation between 2 points Distance between 2 points Calculating Gradient (or Slope) Gradient = Gradient is usually expressed as ft/mi.
Engineering Geology Earth’s Structure Elevation from Contours Elevations of points between contours can be determined by interpolation. =168.75ft
Engineering Geology Slope from Contours The percent slope can be determined from the contour lines on a topographic map as: ×100% Rise = 200 - 150 = 50 ft Run = 2.625 in x 1,000 ft/in ×100% =1.9%
Engineering Geology Interpolation by Calculation and measurement
Engineering Geology Stony Meteorites
Engineering Geology Topographic Profiles Topographic maps represent a view of the landscape as seen from above (called “map view”). For producing a detailed study of a landform it is necessary to construct a topographic profile. A topographic profile is a cross-sectional view along a line drawn through a portion of a topographic map.
Engineering Geology Creating Topographic Profiles • Draw a line from Point A to Point A’ where you want a cross-sectional view of the topography.
Engineering Geology • Lay a strip of paper along a line across the area where the profile is to be constructed. • Mark on the paper the exact place where each contour, stream and hill top crosses the profile line. • Label each mark with the elevation of the contour it represents.
Engineering Geology e. Prepare a vertical scale on profile paper by labeling the horizontal lines corresponding to the elevation of each index contour line.
Engineering Geology • Place the paper with the labeled contour lines at the bottom of the profile paper and project each contour to the horizontal line of the same elevation. • Connect the points.
Horizontal Scale Engineering Geology Vertical Exaggeration Vertical Scale VE = Example: VE = 1:2000/1:4000 = 2 This means... "the vertical relief of the terrain portrayed in this profile view is exaggerated two-fold relative to its actual profile in the real-world".
Engineering Geology Colors indications on contour maps. • Water is shown in blue. • Densely populated areas are shown in gray or pink. • Wooded areas are in green and open areas in white. • Individual buildings are solid black shapes
Engineering Geology Surfer Software Surfer’s outstanding gridding and contouring capabilities have made Surfer the software of choice for working with XYZ data