Understanding the Role of SMAD Proteins and PAWS1 in BMP Signaling Pathway
This study explores the interaction between SMAD proteins, PAWS1, and BMP signaling in various tissues, shedding light on the molecular mechanisms involved.


Understanding the Role of SMAD Proteins and PAWS1 in BMP Signaling Pathway
E N D
Presentation Transcript
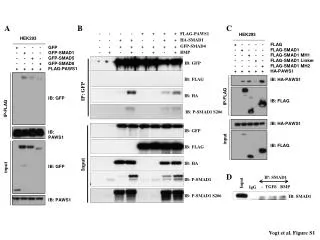
A B C - - - - + + + + FLAG-PAWS1 HEK293 HEK293 HA-SMAD1 - - + + - - + + + - - - - + - + - - - + - - + - - + - - - + - + - - - - + + FLAG FLAG-SMAD1 FLAG-SMAD1 MH1 FLAG-SMAD1 Linker FLAG-SMAD1 MH2 HA-PAWS1 GFP-SMAD4 - - + + + + + + + - - - + - + - - + - - + - + - - - + + GFP GFP-SMAD1 GFP-SMAD5 GFP-SMAD8 FLAG-PAWS1 BMP - + - + - + - + IB: GFP IB: FLAG IB: HA-PAWS1 IP: GFP IP-FLAG IB: HA IB: GFP IB: FLAG IP-FLAG IB: P-SMAD1 S206 IB: HA-PAWS1 input IB: GFP IB: PAWS1 IB: FLAG IB: FLAG input IB: HA Input IB: GFP D IB: P-SMAD1 IB: P-SMAD1 S206 IB: PAWS1 IP: SMAD1 Input - TGFß BMP IgG IB: SMAD1 Vogt et al. Figure S1
MDA-MB-231 U2OS HEK 293 RKO HaCaT HeLa MCF7 PC3 KBM7 IB: PAWS1 low PAWS1 IB: PAWS1 high A B PAWS1 IB: PAWS1 low Adiposetissue IB: SMAD1 Pancreas Epididymis Muscle Ovaries IB: PAWS1 high Spleen Thymus Kidney Testis Heart Brain Liver Lung IB: GAPDH IB: SMAD1 IB: GAPDH Vogt et al. Figure S2
ALK2 ALK6 0.010 0.100 0.100 0.001 0.001 0.010 0.003 0.030 0.300 1.000 3.000 10.00 0.003 0.030 0.300 1.000 3.000 10.00 0.000 0.000 LDN-193189 (µM) Coomassie 32P-Autorad Phospho-PAWS1 Vogt et al. Figure S3
A BMPR1 + GST-PAWS1(S610A) P1 662.6184 +2P P2 B 953.4414 +P Peak2 C Peak1 Vogt et al. Figure S4
120 240 45 0 BMP for min. 15 480 IP: PAWS1; IB: P-PAWS1 S610 IP: PAWS1; IB: PAWS1 IB: P-SMAD1 IB: SMAD1 IB: GAPDH Vogt et al. Figure S5
B A BxPC3 3 ASNS P<0.001 P<0.001 NEDD9 2 foldchange 1 0 - BMP 2 BMP 4/7 Vogt et al. Figure S6
Change in expression PAWS1+BMP/control 1.2 1 0.8 0.6 0.4 0.2 log fold change 0 -0.2 -0.4 -0.6 -0.8 -1 -1.2 genes below threshold genes above threshold A B unstimulated BMP-2 TGFBR2 ID1 PC3-control PC3-control PC3-control PC3-PAWS1 PC3-PAWS1 PC3-PAWS1 TSC22D C TGFBR2 TSC22D P=0.0007 P=0.0029 2.5 1.5 40 2.0 30 1.0 1.5 fold change fold change fold change 20 1.0 0.5 10 P<0.0001 0.5 ID1 P<0.0001 0.0 0.0 0 Vogt et al. Figure S7