Download
1 / 11
110 likes | 305 Vues
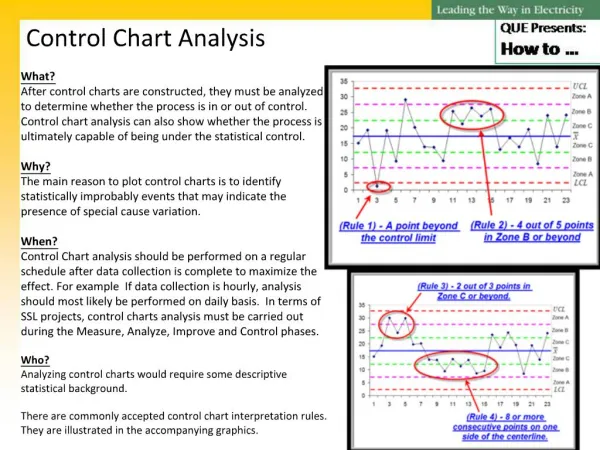
T20-06 Control Chart (with Runs Tests). Purpose Allows the analyst create and analyze a "Control Chart". A visual analysis of the control time series with upper and lower confidence limits is shown along with the A/B and U/D "runs tests" for randomness.

E N D
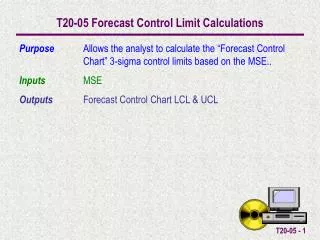
T20-06 Control Chart (with Runs Tests) Purpose Allows the analyst create and analyze a "Control Chart". A visual analysis of the control time series with upper and lower confidence limits is shown along with the A/B and U/D "runs tests" for randomness. Inputs Observed Sample Statistics (range, means, proportions, or defects per unit) Control Chart Centerline, LCL, and UCL Outputs Control Chart Runs Tests
Run Charts – Check For Randomness Used in conjunction with control charts to test for randomness of observational data. The presence of patterns in the data or trends indicates that non-random (assignable) variation is present. A run is a sequence of observations with a certain characteristic. Two useful run tests: . Runs above and below the centerline data translated into A (above) and B (below) . Runs up and down data translated into U (up) and D (down)
Counting A/B Runs Counting Above/Below Runs (7 runs) B1 A2 A2 B3 A4 B5 B5 B5 A6 A6 B7 If a value is equal to the centerline, the A/B rating is different from the last A/B rating.
Counting U/D Runs Counting Up/Down Runs (8 runs) U1 U1 D2 U3 D4 U5 D6 U7 U7 D8 Note: the first value does not receive a notation If two values are equal, the U/D rating is different from the last U/D rating.
Expected Number of Runs Once the runs are counted they must be compared to the expected number of runs in a completely random series. The expected number of runs and the standard deviation of the expected number of runs are computed by the following formula:
Compare Observed Runs to Expected Runs Next, we compare the observed number of runs to the expected number of runs by calculating the following Standard Normal Z-statistic:
Runs Test - In or Out of Control For a degree of confidence of 99.7% (3 standard deviations), we compare the comparison to -3 standard deviations and + 3 standard deviations. . If either the Zab or Zud is ..< lower limit (-3) then we have too few runs(Out of Control) ..Between the lower limit (-3) and upper limit (+3) then we have an acceptable number of runs(In Control) ..> upper limit (+3) then we have too many runs(Out of Conrtrol) Acceptable number Runs Too Few Runs Too Many Runs -3.00 3.00
Example The observed means of 20 samples each containing 5 observations are shown here. The Centerline = 3.4995, LCL = 3.4849, and UCL = 3.5141 have been calculated Create the Control Chart and conduct the A/B, U/D Runs Tests for randomness.
Input the Centerline, LCL, UCL, and Observed Values for the appropriate control chart in the light green cells.
Input the Control Chart is automatically displayed showing the Centerline, LCL, UCL, and ObservedValues
Input the Sigma Level and the A/B and U/D Runs Tests are automatically calculated.