Download

1 / 14
190 likes | 721 Vues
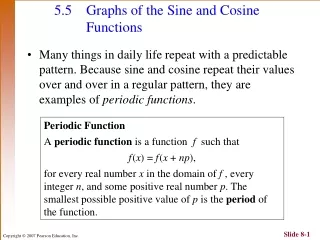
Graphs of Sine and Cosine Functions. Properties of the Sine Function. 1. The domain is the set of all real numbers 2. The range consists of all real numbers from -1 to 1. 3. The sine function is an odd function (symmetric with respect to origin)

E N D
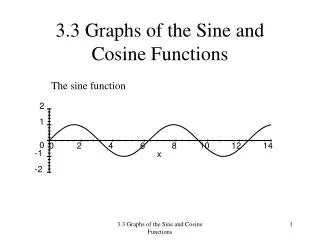
Properties of the Sine Function • 1. The domain is the set of all real numbers • 2. The range consists of all real numbers from -1 to 1. • 3. The sine function is an odd function (symmetric with respect to origin) • 4. The sin function is periodic, with period 2π. • 5. The x-intercepts are -2 π, π, 0, π, 2 π . . . • 6. The y-intercept is . • 7. The maximum value is 1 and occurs at
Properties of the Cosine Function • 1. The domain is the set of all real numbers • 2. The range consists of all numbers from -1 to 1 • 3. The cosine function is an even function (symmetric with respect to the y-axis) • 4. The cosine function is periodic, with period 2π • 5. The x-intercepts are • 6. The y-intercept is 1. • 7. The maximum value is 1 and occurs at -2π,0,2 π, 4 π; • the minimum value is -1 and occurs at x = - π, π, 3 π
Sinusoidal Graphs • Because of the similarity, the graphs of sine and cosine functions are referred to as sinusoidal graphs.
Theorem • If ω>0, the amplitude and period of • y = A sin (ωx) and y = A cos (ωx) are given by • Amplitude = |A| and • Period = T = 2π/ ω
Finding the Amplitude and Period and Graphing It • y = -4 cos (πx) • y = 3 sin (4x) • y = 2 sin (- π/2 x)
Finding an Equation for a Graph • p. 425
On-line Help • Video Tutorials • Examples