Download

1 / 12
120 likes | 273 Vues
*Sketch sine and cosine graphs *Use amplitude and period *Sketch translations of sine and cosine graphs. 4.5 Graphs of Sine and Cosine Functions. One period = the intercepts, the maximum points, and the minimum points. Key Points.

E N D
*Sketch sine and cosine graphs *Use amplitude and period *Sketch translations of sine and cosine graphs 4.5 Graphs of Sine and Cosine Functions
One period = the intercepts, the maximum points, and the minimum points Key Points
Amplitude: of y = a sinx and y = a cosx represent half the distance between the maximum and minimum values of the function and is given by • Amplitude = IaI • Period: Let be be a positive real number. The period of y = a sinbx and y = a cosbx is given by • Period = (2π)/b Amplitude and Period of Sine and Cosine Curves
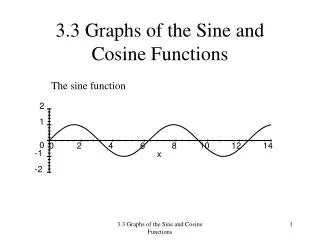
Sketch the graph y = 2sinx by hand on the interval [-π, 4π] Graphing By Hand
Sketch the graph of y = cos (x/2) by hand over the interval [-4π, 4π] Graphing Using Period
The constant c in the general equations • y = a sin(bx – c) and y = a cos(bx – c) create horizontal translations of the basic sine and cosine curves. • One cycle of the period starts at bx – c = 0 and ends at bx – c = 2π • The number c/b is called a phase shift Translations of Sine and Cosine
Sketch the graph y = ½ sin (x – π/3) Horizontal Translation
Sketch the graph y = 2 + 3 cos2x Vertical Translations
Find the amplitude, period, and phase shift for the sine function whose graph is shown. Then write the equation of the graph. Writing an Equation
For a person at rest, the velocity v (in liters per second) of air flow during a respiratory cycle (the time from the beginning of one breath to the beginning of the next) is given by where t is the time (in seconds) . (inhalation occurs when v> 0 and exhalation occurs when v < 0 ) • Graph on the calculator • Find the time for one full respiratory cycle • Find the number of cycles per minute • The model is for a person at rest. How might the model change for a person who is exercising?
A company that produces snowboards, which are seasonal products, forecast monthly sales for 1 year to be where S is the sales in thousands of units and t is the time in months, with t = 1 corresponding to January. • Graph the function for a 1 year period • What months have maximum sales and which months have minimum sales.
Throughout the day, the depth of the water at the end of a dock in Bangor, Washington varies with the tides. The table shows the depths (in feet) at various times during the morning. • Use a trigonometric function to model this data. • A boat needs at least 10 feet of water to moor at the dock. During what times in the evening can it safely dock? Mathematical Modeling