Download
1 / 39
420 likes | 632 Vues
Graphs of Sine and Cosine Functions. Section 4.5. Objectives. Sketch the graphs of sine and cosine functions and their variations. Use amplitude and period to help sketch the graphs of sine and cosine functions. Sketch translations of graphs of sine and cosine.

E N D
Graphs of Sine and Cosine Functions Section 4.5
Objectives • Sketch the graphs of sine and cosine functions and their variations. • Use amplitude and period to help sketch the graphs of sine and cosine functions. • Sketch translations of graphs of sine and cosine.
90° 120° 60° 135° 45° 150° 30° 180° 0° 330° 210° 225° 315° 240° 300° 270° y = sin x 1 90° 180° 360° 270° –1
90° 120° 60° 135° 45° 150° 30° 180° 0° 330° 210° 225° 315° 240° 300° 270° y = sin x 90° 180° 270° 360°
Values of (x, y) on the graph of • Sine starts at the sea shore
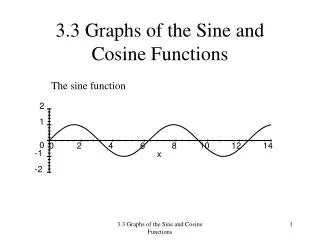
x 0 sin x 0 1 0 -1 0 y = sin x y x Graph of the Sine Function To sketch the graph of y = sin xwe don’t need many points, just the key points.These are the maximum points, the minimum points, and the intercepts. Divide the cycle of into four equal parts. Then, connect the five critical points on the graph with a smooth curve that extends in both directions beyond the five points. A single cycle is called a period.
Amplitude • The amplitude is the maximum height above or below the center line. • The standard sine curve y = sin x has an amplitude = 1 • y = The equation has an amplitude = |A| • has an amplitude of 2. • has an amplitude of 2. Amplitude
The period is the distance between two peaks or valleys. y = sin x has period 2π y = sin(Bx) has period Period Period
Amplitude (the height) Period: (the cycle) Phase Shift: The phase shift is a right or left shift of the graph.
y y = 2 sin x x y = sin x y = sin x y = –4 sin x reflection of y = 4 sin x y = 4sin x Graphing Variations of • Identify the amplitude and the period. • Find the values of x for the five key parts---the x-intercepts (3 for sine), the maximum point, and the minimum point. • Divide the period into 4 quarter-periods. • Plot the five key points. • Connect the key points with a smooth graph and graph one complete cycle. • Extend the graph in step 4 to the left or right as desired. (phase shift)
Free Graph Paper for Graphing Trig Functions http://mathbits.com/MathBits/StudentResources/GraphPaper/GraphPaper.htm
Graphing Variations of Graph for • Identify the amplitude and the period. • Find the values of x for the five key parts---the x-intercepts (3 for sine), the maximum point, and the minimum point. Divide the period into 4 quarter-periods. • Plot the five key points. • Connect the key points with a smooth graph and graph one complete cycle. • Extend the graph in step 4 to the left or right as desired.
Graph for Period The amplitude =
Graph for Period The amplitude =
2 2 period: = 3 y ( , 2) x (0, 0) ( , 0) ( , 0) ( ,-2) x 0 0 2 –2 y = –2 sin 3x 0 0 Example: Sketch the graph of y = 2 sin(–3x). Rewrite the function in the form y = a sin bx with b > 0 y = 2 sin (–3x) = –2 sin 3x Use the identity sin (– x) = – sin x: amplitude: |a| = |–2| = 2 Calculate the five key points.
y = A sin Bx Starting point: x = C/B The Graph of The graph of is obtained by horizontally shifting the graph of so that the starting point of the cycle is shifted from to . If , the shift is to the right. If , the shift is to the left. The number is called the phase shift. amplitude = || period y Amplitude: | A| phase shift x Period:2/B
Determine the amplitude, period, and phase shift of Amplitude = Maximum height Period = One cycle Phase shift = Starting point to the right
Graph Amp = 2 Period = Phase shift =
Amplitude (height) Period: (cycle) Phase Shift: (Shift right or left) Vertical Shift (Up or down)
y = a sin(bx – c) + d Vertical shift is the amount that the red curve is moved up (or down) compared to the reference (black) curve. A positive shift means an upward displacement while a negative shift means a downward displacement. vertical shift This black curve is for reference.
Graphing a Function in the Form • Identify the amplitude and the period, the phase shift, and the vertical shift. • Find the values of x for the five key parts---the x-intercepts (3 for sine), the maximum point, and the minimum point. Divide the period into 4 quarter-periods. • Find and plot the five key points. • Connect the key points with a smooth graph and graph one complete cycle. • Extend the graph in step 4 to the left or right and up or down as desired Determine the amplitude, period, and phase shift and vertical shift of . Then graph one period of the function. Graph of Sine Applet
Graph Example Graph y = 2 sin(4x + ) - 1. Solution Express y in the form A sin(Bx– C) + D. Amplitude = 2 Period Phase shift = Vertical shift is down 1 unit.
y = sin(–x) x y Example 1: Sketch the graph of y = sin(–x). The graph of y = sin(–x) is the graph of y = sin x reflected in the x-axis. Use the identity sin(–x) = – sin x y = sin x
Values of (x, y) on the graph of • Cosine starts on the cliff
x 0 cos x 1 0 -1 0 1 y = cos x y x Graph of the Cosine Function To sketch the graph of y = cos x first locate the key points.These are the maximum points, the minimum points, and the intercepts. Then, connect the points on the graph with a smooth curve that extends in both directions beyond the five points. A single cycle is called a period.
Graphing Variations of • Identify the amplitude and the period. • Find the intercepts (one y-intercept and two x-intercepts, the maximum point, and the minimum point. Divide the period into 4 quarter-periods. • Plot the five key points. • Connect the key points with a smooth graph and graph one complete cycle. • Extend the graph in step 4 to the left or right as desired.
Graph Amplitude 1 Period
x 0 2 3 0 -3 0 3 y = 3 cos x max x-int min x-int max y (0, 3) ( , ,3) x ( , 0) ( , 0) ( , –3) Example: Sketch the graph of y = 3 cos x Partition the interval [0, 2] into four equal parts. Find the five key points; graph one cycle; then repeat the cycle over the interval.
Amplitude (the height) Period: (the cycle) Phase Shift: The phase shift is a right or left shift of the graph.
The Graph of The graph of is obtained by horizontally shifting the graph of so that the starting point of the cycle is shifted from to . If , the shift is to the right. If , the shift is to the left. The number is called the phase shift. amplitude = period =
Graphing a Function in the Form Determine the amplitude and period of • Identify the amplitude and the period. • Find the intercepts (one y-intercept and two x-intercepts, the maximum point, and the minimum point. Divide the period into 4 quarter-periods. • Plot the five key points. • Connect the key points with a smooth graph and graph one complete cycle. • Extend the graph in step 4 to the left or right as desired. Graph of Cosine Applet
Graphing a Function in the Form Determine the amplitude and period of . Graph one period of the function. • Identify the amplitude, the period, and the phase shift. • Find the intercepts (one y-intercept and two x-intercepts, the maximum point, and the minimum point. Divide the period into 4 quarter-periods. • Plot the five key points. • Connect the key points with a smooth graph and graph one complete cycle. • Extend the graph in step 4 to the left or right as desired. Graph of Cosine Applet
Amplitude Period: 2π/b Phase Shift: c/b Vertical Shift
2 0 - 2 Vertical Translation - Example Vertical Translation = 3 units upward, since d > 0 30˚ 60˚ 90˚ 120˚
y x y = cos (–x) Sketch the graph of y = cos(–x). The graph of y = cos (–x) is identical to the graph of y = cosx. Use the identitycos(–x) = cosx Cosine is an even function. y = cos (–x)