Download
1 / 31
490 likes | 1.15k Vues
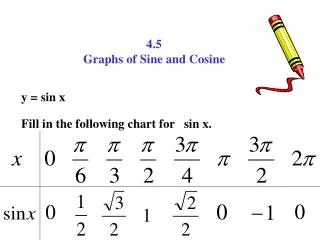
4.5 Graphs of Sine and Cosine Functions. JMerrill , 2010. Amplitude: Sine Function. 0. 1. 0. -1. 0. The maximum height of the sine function is 1. It goes one unit above and one unit below the x-axis, which is the center of it’s graph. This maximum height is called the amplitude. 1.

E N D
4.5Graphs of Sine and Cosine Functions JMerrill, 2010
Amplitude: Sine Function 0 1 0 -1 0 The maximum height of the sine function is 1. It goes one unit above and one unit below the x-axis, which is the center of it’s graph. This maximum height is called the amplitude. 1 1
Amplitude: Cosine Function 1 0 1 0 -1 The maximum height of the cosine function is 1. It goes one unit above and one unit below the x-axis, which is the center of it’s graph. This maximum height is called the amplitude. 1 1
Amplitude The amplitude of the normal sine or cosine function is 1. To change the amplitude of a sine or cosine function, you would need to vertically stretch or shrink the function. amplitude = |A| (Choose the line that is dead-center of the graph. The amplitude has the same height above the center line (axis of the wave) as the height below the center line.
What is the amplitude? Examples Vert. stretch by 3 Vert. shrink by ½ Vert. shrink by π/4
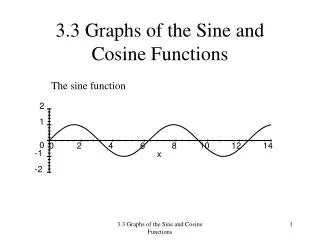
Period: Sine Function 0 1 0 -1 0 This one piece of the sine function repeats over and over, causing the sine function to be periodic. The length of this piece is called the period of the function.
Period: Cosine Function 1 0 1 0 -1 This one piece of the cosine function repeats over and over, causing the cosine function to be periodic. The length of this piece is called the period of the function.
Period The period of a normal sine or cosine function is 2π. To change the period of a sine or cosine function, you would need to horizontally stretch or shrink the function. The period is found by: period = In the equation, b affects the frequency, which is related to the period.
The period of the sinx (parent) is 2π The period of sin2x is π.p= If b > 1, the graph shrinks. This graph is happening twice as often as the original wave. PeriodExamples of f(x) = sin bx
PeriodExamples of f(x) = sin bx • The period of y = sinx (parent) is 2π • The period of sin ½ x is π.p= • If b < 1, the graph stretches. • This graph is happening half as often as the original wave.
What is the period? Examples Horiz. stretch by ½ Horiz. shrink by 3 Horiz. shrink by 2π/3 Horiz. shrink by π/2
Examples: y = A sin bx y = A cos bx • Give the amplitude and period of each funtion: • Y = 4 cos 2x • A = 4, • y= -4 sin 1/3 x • A = 4,
Sine or cosine? Amplitude? Period? b? Equation? Can You Write the Equation? 2
Sine or Cosine? Amplitude? Period? b? Equation: Equation? 2 8
Translations of General Sine Waves What does a refer to? • Referring to our previous equations y = a sin bx y = a cos bx • If we translate the graphs h units horizontally, and k units vertically, then the resulting equations are: y = d + a sin b(x - c) y = d + a cos b(x - c) This is different than the book. My way is easier!! What does b refer to?
Phase Shift When a graph is shifted c units horizontally, then x is replaced with (x-c) Remember that a phase shifts acts in the opposite direction—just like all other functions. Shifts 1
Shifts • Vertical Shift • When a graph is shifted vertically, then y = d + blahblahblah is the equation. 4
When the sine wave is shifted units to the left, what is the result? A cosine wave! So, sine and cosine curves are referred to as general sine waves. Shifts
Amplitude revisited • If the center of the wave is not at the x-axis, then amplitude can be found by • Amplitude can still be measured by the vertical distance between the center of the wave to the peak (and/or valley)
Axis of the Wave (Vertical Translation) • If the x-axis is notthe center of the wave, then you need to find the center. The center is the average of the peak and the valley points • Axis of the wave: x =
Example • To find the amplitude • To find the axis of the wave • To verify the amplitude, what is the vertical distance from the axis of the wave to the peak or valley? 3 3
Write the Equation • Axis of the wave? • Amplitude? • Period? 4 • So, a = 2, b = ?
Write the Equation • To write the equation, look at the new x/y-axis (forget the old). Here, we changed the x-axis, but not the y-axis. • Sine or cosine? Cosine • The vertical shift is the amount we raised the x-axis. • Equation?
Axis of the wave? x = 2 Amplitude? Period? B? Sine or cosine? Can’t tell? Move the y-axis. Sine or cosine? Now, use the new set of axes and write the equation. Write the Equation
a = 1 Cosine wave Equation: Write the Equation
Axis of wave = 2 Move the y-axis to the left ½ unit. Now it’s a sine wave! Equation? Same Graph - 2nd Equation
Equations of the Graph • Since sine and cosine are both general sine waves, both equations are correct!
You Do • Cosine wave: • Another cosine wave?
Same Wave • Sine wave:
Graphing:Find the Critical points • To find the critical intervals (max/min, intercepts) • To find the endpoint when graphing 2 complete cycles (always graph 2):
Graphing by Hand • 2 examples we’ll do by hand: