Download

1 / 15
150 likes | 873 Vues
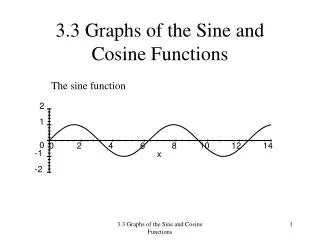
Graphs of Sine and Cosine Functions. y. y = sin x , 0 < x < 2 . 1. x. ˝. . . . 3 . 2 . 6. 3. 2. 2. -1. Period: 2 . The Graph of y=sinx.

E N D
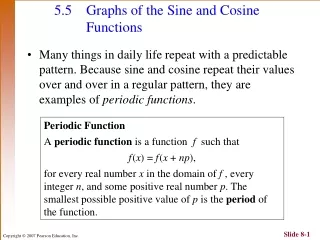
y y = sin x, 0 < x < 2 1 x ˝ 3 2 6 3 2 2 -1 Period: 2 The Graph of y=sinx The trigonometric functions can be graphed in a rectangular coordinate system by plotting points whose coordinates belong to the function. Thus, we graph y = sin x by listing some points on the graph. Because the period of the sine function is 2 we will graph the function on the interval [0, 2]. The rest of the graph is made up of repetitions of this portion.
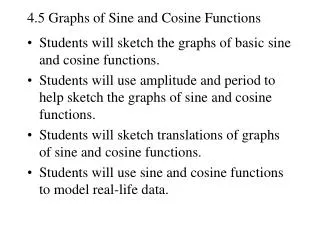
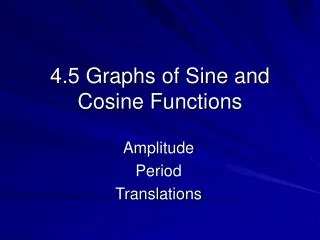
Graphing Variations of y=sinx • Identify the amplitude and the period. • Find the values of x for the five key points – the three x-intercepts, the maximum point, and the minimum point. Start with the value of x where the cycle begins and add quarter-periods – that is, period/4 – to find successive values of x. • Find the values of y for the five key points by evaluating the function at each value of x from step 2. • Connect the five key points with a smooth curve and graph one complete cycle of the given function. • Extend the graph in step 4 to the left or right as desired.
Solution Step 1 Identify the amplitude and the period. The equation y = 1/2 sin x is of the form y = A sin x with A = 1/2. Thus, the amplitude |A| = 1/2. This means that the maximum value of y is 1/2 and the minimum value of y is -1/2. The period for both y = 1/2 sin x and y = sin x is 2. Text Example Determine the amplitude of y = 1/2 sin x. Then graph y = sin x and y = 1/2 sin x for 0 <x< 2.
Solution Step 2 Find the values of x for the five key points. We need to find the three x-intercepts, the maximum point, and the minimum point on the interval [0, 2]. To do so, we begin by dividing the period, 2, by 4. Period/4 = 2 /4 = /2 We start with the value of x where the cycle begins: x = 0. Now we add quarter periods, /2, to generate x-values for each of the key points. The five x-values are x = 0, x = 0 + /2 = /2, x = /2 + /2 = , x = + /2 = 3 /2, x= 3 /2 + /2 = 2 Text Example cont.
Text Example cont. Solution Step 3 Find the values of y for the five key points. We evaluate the function at each value of x from step 2. y = 1/2 sin0 = 0 (0,0) y = 1/2sin/2 = 1/2*1 = 1/2 (/2, 1/2) y = 1/2sin = 1/2*0 = 0 (,0) y = 1/2 sin 3/2 = 1/2(-1) = -1/2 (3 /2, -1/2) y = 1/2sin2 = 1/2*0 = 0 (2, 0) There are x-intercepts at 0, and 2 . The maximum and minimum points are (/2, 1/2) and (3 /2, -1/2)
y y = sin x 1 y = 1/2sinx 2˝ x ˝ -1 Text Example cont. Solution Step 4 Connect the five key points with a smooth curve and graph one complete cycle of the given function. The five key points for y = 1/2sin x are shown below. By connecting the points with a smooth curve, the figure shows one complete cycle of y = 1/2sin x. Also shown is graph of y = sin x. The graph of y = 1/2sin x shrinks the graph of y = sin x.
y y = A sin Bx x Amplitude: | A| Period:2/B Amplitudes and Periods The graph of y = A sin Bx has amplitude = | A| period = 2/B.
y = A sin Bx Starting point: x = C/B The Graph of y = Asin(Bx - C) The graph of y = A sin (Bx – C) is obtained by horizontally shifting the graph of y = A sin Bx so that the starting point of the cycle is shifted from x = 0 to x = C/B. The number C/B is called the phase shift. amplitude = | A| period = 2 /B. y Amplitude: | A| x Period:2/B
Determine the amplitude, period, and phase shift of y = 2sin(3x-) Solution: Amplitude = |A| = 2 period = 2/B = 2/3 phase shift = C/B = /3 Example
Example cont. • y = 2sin(3x- )
. y 1 x - 2 -/2 -3/2 /2 3/2 5/2 -1 Period: 2 The Graph of y = AcosBx We graph y = cos x by listing some points on the graph. Because the period of the cosine function is 2, we will concentrate on the graph of the basic cosine curve on the interval [0, 2 ]. The rest of the graph is made up of repetitions of this portion.
y = A cos Bx y Amplitude: | A| x 2/B Period:2/B The Graph of y = AcosBx The graph of y = A cos Bx has amplitude = | A| period = 2/B.
y = A cos( Bx-C) y Amplitude: | A| x Period:2/B The Graph of y = Acos(Bx - C) The graph of y = A cos (Bx – C) is obtained by horizontally shifting the graph of y = A cos Bx so that the starting point of the cycle is shifted from x = 0 to x = C/B. The number C/B is called the phase shift. amplitude = | A| period = 2 /B.