Project Time Planning and Networks
920 likes | 1.16k Vues
Henry Yuliando Oct 2012. Project Time Planning and Networks. Project Management. Context. A uniqueness implies that every project must be defined a new and a scheme created telling everyone involved what to do.

Project Time Planning and Networks
E N D
Presentation Transcript
Henry Yuliando Oct 2012 Project Time Planning andNetworks Project Management
Context A uniqueness implies that every project must be defined anew and ascheme created telling everyone involved what to do. Decidingand specifying what they have to do is the function of projectdefinition , the output of which is a project plan. Making surethey do it right is the function of project control.
Learning from Past Projects • Learning from Past Projects • While developing a project plan, the project manager refer to earlier, similar projects (plans, procedures, successes, and failures). • Ideally the project manager is providedwith planning assistance in the form of lessons learned, best practices, suggestedmethodologies and templates, and even consulting advice derived from experience in past projects.
Project Management Activities • Planning • Objectives • Resources • Work break-down schedule • Organization • Scheduling • Project activities • Start & end times • Network • Controlling • Monitor, compare, revise, action
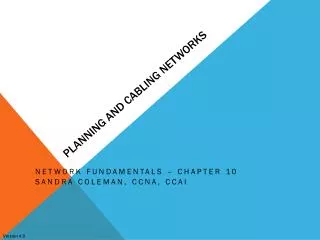
Before Start of project During project Timeline project Project Planning, Scheduling, and Controlling Figure 3.1
Before Start of project During project Timeline project Project Planning, Scheduling, and Controlling Figure 3.1
Before Start of project During project Timeline project Project Planning, Scheduling, and Controlling Figure 3.1
Before Start of project During project Timeline project Project Planning, Scheduling, and Controlling Figure 3.1
Time/cost estimates Budgets Engineering diagrams Cash flow charts Material availability details Budgets Delayed activities report Slack activities report CPM/PERT Gantt charts Milestone charts Cash flow schedules Before Start of project During project Timeline project Project Planning, Scheduling, and Controlling Figure 3.1
Project Planning • Establishing objectives • Defining project • Creating work breakdown structure • Determining resources • Forming organization
Project Organization • Often temporary structure • Uses specialists from entire company • Headed by project manager • Coordinates activities • Monitors schedule and costs • Permanent structure called ‘matrix organization’
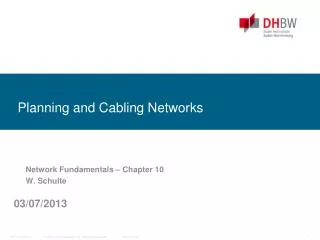
President Human Resources Finance Marketing Design Quality Mgt Production Project Manager Project 1 Mechanical Engineer Test Engineer Technician Project Manager Project 2 Electrical Engineer Computer Engineer Technician A Sample Project Organization Figure 3.2
Project Management Techniques • Gantt chart • Critical Path Method (CPM) • Program Evaluation and Review Technique (PERT)
Six Steps PERT & CPM • Define the project and prepare the work breakdown structure • Develop relationships among the activities - decide which activities must precede and which must follow others • Draw the network connecting all of the activities
Six Steps PERT & CPM • Assign time and/or cost estimates to each activity • Compute the longest time path through the network – this is called the critical path • Use the network to help plan, schedule, monitor, and control the project
A comes before B, which comes before C A C (a) B A B C A A A and B must both be completed before C can start (b) C C B B B B and C cannot begin until A is completed B A (c) A C C A Comparison of AON and AOA Network Conventions Activity on Activity Activity on Node (AON) Meaning Arrow (AOA) Figure 3.5
C and D cannot begin until A and B have both been completed A C B A C (d) D B D C cannot begin until both A and B are completed; D cannot begin until B is completed. A dummy activity is introduced in AOA A C A C (e) Dummy activity B D B D A Comparison of AON and AOA Network Conventions Activity on Activity Activity on Node (AON) Meaning Arrow (AOA) Figure 3.5
B and C cannot begin until A is completed. D cannot begin until both B and C are completed. A dummy activity is again introduced in AOA. A B D B A Dummy activity C (f) C D A Comparison of AON and AOA Network Conventions Activity on Activity Activity on Node (AON) Meaning Arrow (AOA) Figure 3.5
AON Example Milwaukee Paper Manufacturing'sActivities and Predecessors Table 3.1
Activity A (Build Internal Components) A Start Activity B (Modify Roof and Floor) B Start Activity AON Network for Milwaukee Paper Figure 3.6
Activity A Precedes Activity C A C Start B D Activities A and B Precede Activity D AON Network for Milwaukee Paper Figure 3.7
F A C E Start H B G D Arrows Show Precedence Relationships AON Network for Milwaukee Paper Figure 3.8
C (Construct Stack) 4 2 F (Install Controls) A (Build Internal Components) E (Build Burner) H (Inspect/ Test) Dummy Activity 7 1 6 B (Modify Roof/Floor) G (Install Pollution Device) D (Pour Concrete/ Install Frame) 3 5 AOA Network for Milwaukee Paper Figure 3.9
Determining the Project Schedule Perform a Critical Path Analysis • The critical path is the longest path through the network • The critical path is the shortest time in which the project can be completed • Any delay in critical path activities delays the project • Critical path activities have no slack time
Activity Description Time (weeks) A Build internal components 2 B Modify roof and floor 3 C Construct collection stack 2 D Pour concrete and install frame 4 E Build high-temperature burner 4 F Install pollution control system 3 G Install air pollution device 5 H Inspect and test 2 Total Time (weeks) 25 Determining the Project Schedule Perform a Critical Path Analysis Table 3.2
Earliest start (ES) = earliest time at which an activity can start, assuming all predecessors have been completed Earliest finish (EF) = earliest time at which an activity can be finished Latest start (LS) = latest time at which an activity can start so as to not delay the completion time of the entire project Latest finish (LF) = latest time by which an activity has to be finished so as to not delay the completion time of the entire project Activity Description Time (weeks) A Build internal components 2 B Modify roof and floor 3 C Construct collection stack 2 D Pour concrete and install frame 4 E Build high-temperature burner 4 F Install pollution control system 3 G Install air pollution device 5 H Inspect and test 2 Total Time (weeks) 25 Determining the Project Schedule Perform a Critical Path Analysis
Activity Name or Symbol A Earliest Finish Earliest Start ES EF LS LF Latest Finish Latest Start 2 Activity Duration Determining the Project Schedule Perform a Critical Path Analysis
AON Example Milwaukee Paper Manufacturing'sActivities and Predecessors
Forward Pass Begin at starting event and work forward Earliest Start Time Rule: • If an activity has only one immediate predecessor, its ES equals the EF of the predecessor • If an activity has multiple immediate predecessors, its ES is the maximum of all the EF values of its predecessors ES = Max (EF of all immediate predecessors)
Forward Pass Begin at starting event and work forward Earliest Finish Time Rule: • The earliest finish time (EF) of an activity is the sum of its earliest start time (ES) and its activity time EF = ES + Activity time
ES EF = ES + Activity time Start 0 0 0 ES/EF Network for Milwaukee Paper
EF of A = ES of A + 2 ESof A A 2 0 2 Start 0 0 0 ...
EF of B = ES of B + 3 A 2 ESof B 0 2 0 3 Start 0 0 B 3 0 ...
A 2 C 2 0 2 2 4 Start 0 0 0 B 3 0 3 ...
A 2 C 2 0 2 2 4 Start 0 0 = Max (2, 3) D 4 0 3 B 3 0 3 ... 7
A 2 C 2 0 2 2 4 Start 0 0 0 B 3 D 4 0 3 3 7 ...
A 2 C 2 F 3 0 2 4 7 2 4 E 4 H 2 Start 0 0 4 8 13 15 0 B 3 D 4 G 5 0 3 3 7 8 13 ... Figure 3.11
Backward Pass Begin with the last event and work backwards Latest Finish Time Rule: • If an activity is an immediate predecessor for just a single activity, its LF equals the LS of the activity that immediately follows it • If an activity is an immediate predecessor to more than one activity, its LF is the minimum of all LS values of all activities that immediately follow it LF = Min (LS of all immediate following activities)
... Begin with the last event and work backwards Latest Start Time Rule: • The latest start time (LS) of an activity is the difference of its latest finish time (LF) and its activity time LS = LF – Activity time
A 2 C 2 F 3 0 2 4 7 2 4 E 4 H 2 Start 0 0 4 8 13 15 13 15 0 LS = LF – Activity time B 3 D 4 G 5 0 3 3 7 8 13 LF = EF of Project ... Figure 3.12
A 2 C 2 F 3 0 2 4 7 2 4 10 13 E 4 H 2 Start 0 0 LF = Min(LS of following activity) 4 8 13 15 13 15 0 B 3 D 4 G 5 0 3 3 7 8 13 ... Figure 3.12
LF = Min(4, 10) A 2 C 2 F 3 0 2 4 7 2 4 2 4 10 13 E 4 H 2 Start 0 0 4 8 13 15 13 15 4 8 0 B 3 D 4 G 5 0 3 3 7 8 13 8 13 ... Figure 3.12
A 2 C 2 F 3 0 2 4 7 2 4 2 4 10 13 0 2 E 4 H 2 Start 0 0 4 8 13 15 13 15 0 0 4 8 0 B 3 D 4 G 5 0 3 3 7 8 13 4 8 8 13 1 4 ... Figure 3.12
Computing Slack time After computing the ES, EF, LS, and LF times for all activities, compute the slack or free time for each activity • Slack is the length of time an activity can be delayed without delaying the entire project Slack = LS – ES or Slack = LF – EF
Earliest Earliest Latest Latest On Start Finish Start Finish Slack Critical Activity ES EF LS LF LS – ES Path A 0 2 0 2 0 Yes B 0 3 1 4 1 No C 2 4 2 4 0 Yes D 3 7 4 8 1 No E 4 8 4 8 0 Yes F 4 7 10 13 6 No G 8 13 8 13 0 Yes H 13 15 13 15 0 Yes ... Table 3.3
A 2 C 2 F 3 0 2 4 7 2 4 2 4 10 13 0 2 E 4 H 2 Start 0 0 4 8 13 15 13 15 0 0 4 8 0 B 3 D 4 G 5 0 3 3 7 8 13 4 8 8 13 1 4 ... Figure 3.13
Activity on Arrow 2 4 C A F E 1 dummy B 3 5 6 7 D G H
1 2 3 4 5 6 7 8 9 10 11 12 13 14 15 16 A Build internal components B Modify roof and floor C Construct collection stack D Pour concrete and install frame E Build high-temperature burner F Install pollution control system G Install air pollution device H Inspect and test ES – EF Gantt Chartfor Milwaukee Paper
1 2 3 4 5 6 7 8 9 10 11 12 13 14 15 16 A Build internal components B Modify roof and floor C Construct collection stack D Pour concrete and install frame E Build high-temperature burner F Install pollution control system G Install air pollution device H Inspect and test LS – LF Gantt Chartfor Milwaukee Paper
Variability in Activity Times • CPM assumes we know a fixed time estimate for each activity and there is no variability in activity times • PERT uses a probability distribution for activity times to allow for variability