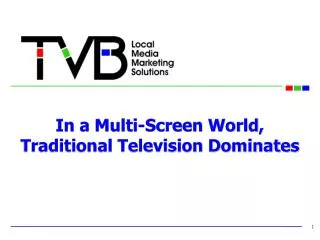
Time Spent with TV Hits Record High in 1Q14, Dominating Video Consumption Trends
The Nielsen Cross-Platform Report for 1Q14 shows that time spent watching TV reached an all-time high of 159 hours and 7 minutes among P2+ viewers, with 2.4 million more people tuning in compared to the previous year. While smartphone video usage grew by 15%, television remains the primary platform for video consumption, commanding over 93% of total viewing time across devices. Despite a shift towards mobile viewing, traditional TV still captivates audiences of all ages and ethnicities, underlining its enduring dominance in the media landscape.


Time Spent with TV Hits Record High in 1Q14, Dominating Video Consumption Trends
E N D
Presentation Transcript
Multi-Screen Insights Time Spent With TV Reaches An All Time High
Multi-Screen Insights Time spent with TV reaches an All Time High – 159:07 Over 2.4 million more people watched TV in 1Q14 Television reigns among young and old; across all ethnic segments; with most viewing occurring with Live TV Viewers continue to shift their viewing from computer (-2%) to phone video (+15%) In spite of mobile video growth, mobile still only comprises a nominal share of total video time (comp video 6.1%/ smartphone video 0.8%) Video game usage is up a slight 3% Households acquired significantly more tablets and enabled smart TVs
Time Spent With TV Reaches Its Highest Level To Date - 159 Hours Time Spent With Television P2+ Monthly (Hrs:Min) Hrs:min 1Q14 159:07 1Q13 157:32 1Q12 155:46 1Q11 158:47 1Q10 158:25 Source: Nielsen Cross Platform Report 1Q14,P2+
Television Commands More Than Half of Total Time Spent With Content Across All Devices Time Spent Per Week (Hrs: Min) Among P18+ Source: Nielsen Cross Platform Report 1Q14,P18+;mobile video= video on smartphone
Majority Of Time Spent Is With Live Television, In Spite of Slight Growth Experienced With Time-Shifted Viewing Time Spent Per Day (Hrs:Min) Among P18+ Source: Nielsen Cross Platform Report 1Q14,P18+; usage on each device
How Much Video Content is Consumed Across Each Device?
With Mobile Video Smartphone Growth, Television Still Dominates 93% Of Total Video Time Monthly Video Consumption by Device Watching Television Watching Video on a Computer Watching Video on a Smartphone # of Viewers v. YAG 285 Million +1% 152 Million -2% 103 Million +15% Time Spent (hrs:min) 159:07 10:49 1:37 Source: Nielsen Cross Platform Report 1Q14,P2+;Total video= TV+comp+smartphone
Among Young & Old, Television Commands Majority of Total Video Time Monthly Time Spent (Hrs:Min) TVShare Internet Mobile of Total Video TV Video Video P2-11 96%111:475:17 - P1217 94%96:216:23 - P18-24 84%111:1519:082:52 P25-34 89%131:3515:371:52 P35-49 93%156:2311:311:12 P50-64 96%202:328:461:02 P65+ 98%234:284:030:26 Source: Nielsen Cross Platform Report 1Q14,P2+; Total video=TV; internet video and mobile video
In Fact, More and More Consumers Tune To Television, 2.4 Million More in 1Q14 Number Of User P2+ Viewing TV 1Q131Q14Absolute Change 282,949,000285,394,000+2,445,000 Source: Nielsen Cross Platform Report 1Q14,P2+
With More Content Being Made Available & More Ease Accessing Video On Mobile Phones, Consumers Continue To Shift Their Video Viewing From Computer To Smartphone Number of Users by Device (P2+)/ Monthly (in OOO’s) 1Q131Q14(+/-) 155,169151,504-3,665 89,749103,459+13,710 121,750 148,983 +27,233 Watching Video on a Computer Watching Video on a Smartphone Using App/Web On Smartphone App/Web usage Is up 22% Source: Nielsen Cross Platform Report 1Q14,P2+;
Despite Smartphone Video Growth, Time Spent With Mobile Is Nominal, Even Among The Younger Consumers Monthly Time Spent (Hrs:Min) Source: Nielsen Cross Platform Report 1Q14, Total video=TV; internet video and mobile video
Video Consumption Continues To Be An Additive PhenomenonAmong Blacks & Hispanics As Television Usage Continues To Grow In Spite Of Mobile’s Growth Gain/LossOf Users P2+ 1Q14 v 1Q13 Black Hispanic Asian +311,000 +1,068,000 -497,000 Watching Traditional Television* v. YAG Watching Video on Computer v. YAG +348,000 -476,000 +157,000 +3,048,000 +1,884,000 Video on Smartphone v. YAG +1,006,000 Source: Nielsen Cross Platform Report, P2+; 1Q14 * includes time-shifted time; **in all TV homes
In Spite of Mobile Growth, Over 90% of Time Spent Is Still Spent With The Television Monthly Time Spent (P2+) in Hours: Minutes Composite Black Hispanic Asian Watching Traditional Television* 159:07 222:41 125:45 92:55 Share Of Total Video Time 93% 93% 90% 82% 15:32 12:40 9:58 10:51 Watching Time-shifted Television** 10:49 13:38 12:16 18:13 Watching Video on Computer Video on Smartphone 1:37 2:21 2:21 1:55 Source: Nielsen Cross Platform Report, P2+; 1Q14 * includes time-shifted time; **in all TV homes
Number of People Using Game Consoles Is Up Slightly Number Of User P2+ Using Game Console 1Q13 1Q14 % Diff 99,275,000 102,142,000 3% Using Game Console Source: Nielsen Cross Platform Report 1Q14; P2+
Households Continue To Acquire More & More Tablets and Enabled Smart TV’s Devices in TV HHs (in OOOs) Composite v. YAG DVD/Blue-ray Player 94,203-0.6% DVR 55,240+6.8% High Definition TV 99,231+8.7% Video Game Console 51,210+2.3% Tablet 37,570+63% Enabled Smart TV 10,212 +98% Source: Nielsen Cross Platform Report 1Q14; P2+