Enhancing Information Visualization with Multi-Screen Analytics at PNNL
This paper discusses the use of large, high-resolution displays for information visualizations at PNNL. It examines various interactive techniques, including video tracking for hand and object movement, and explores different configurations of display surfaces. Highlights include a 23-foot control room wall display, effectively managing vast data quantities from sources like FedEx and VISA transactions. Key themes include collaborative interfaces, interactive visual analytics, and the importance of type-specific visualization techniques in analyzing massive datasets.

Enhancing Information Visualization with Multi-Screen Analytics at PNNL
E N D
Presentation Transcript
Multi-screen Visual Analytics work at PNNL Infovis 2005 Using Large, High-Resolution Displays for Information Visualizations Richard May Jim Thomas
Human Information Workspace • Horizontal Surface • Interaction and Visualization • Video tracking of hands and objects • Vertical Surface • Mostly visualization • Active Stereo • Collaborative Interface and Interaction Research 2
Control Room • 23’ Long Wall Display • Visualization • 2x7 tiled Displays (1536 x 7168) • Support ‘Loosely Tiled’ Displays • Visualization • Treated as Individual Displays • Collection of workstations 3
Research wall • 2 Field of View Wall Display • Barco Galaxy 6 Projectors • 5’ x 14.5’ image area • Display Characteristic Research • Mono and Stereo (Active and Passive) • Edge and Blend matched • Interaction Research NOT the proposed system 4
Dealing with different quantities of data • Information Logistics (Data Sciences) (Data capture->ingest @ massive rates) Explosion of electronic data • 100 million FedEx transactions per day • 150 million VISA credit card transactions per day • 300 million phone long distance calls on ATT’s network per day • 9 billion messages/day, DOD • 35 billion e-mails worldwide per day • 600 billion IP packets perdayon DE-CIX backbone 5
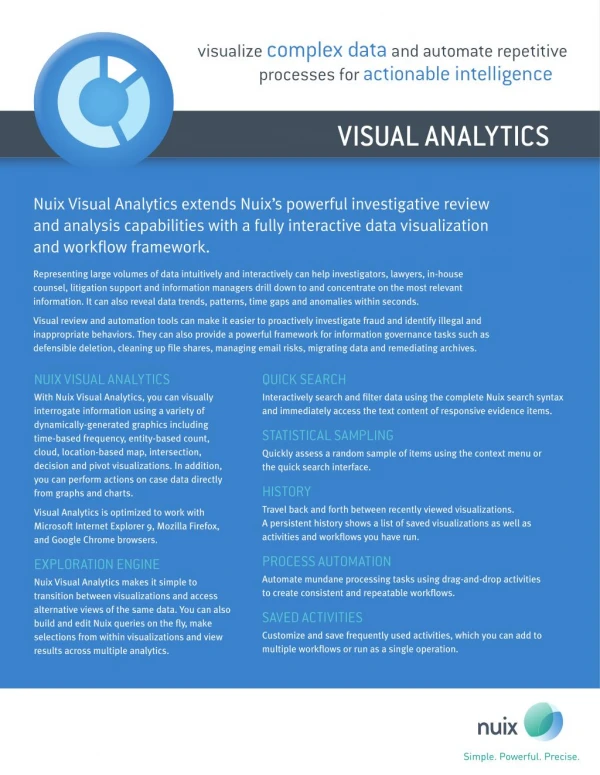
Visual Analytics Visual analytics is the science of analytical reasoning facilitated by interactive visual interfaces. Data Representations & Transformations Visual Representations & Interaction Analytic Reasoning & Discourse 6
Visualization Interaction Interface Covering the Range Complex Large High Res Simple Small Low Res 7