Rise of Digital Video Consumption: Television Still Dominates Viewing Habits
As digital video consumption continues to grow, recent Nielsen reports highlight that it still represents only a nominal share of total viewing time, especially when compared to traditional TV. For audiences aged 18-34, half of all media time is spent on TV, with a significant share dedicated to live broadcasts. Interestingly, while smartphone video viewing is increasing, overall TV time commands over 90% of video engagement across demographic segments. This trend underscores the shifting landscape of media consumption, even as television remains the preferred medium for many.


Rise of Digital Video Consumption: Television Still Dominates Viewing Habits
E N D
Presentation Transcript
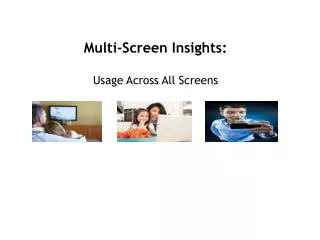
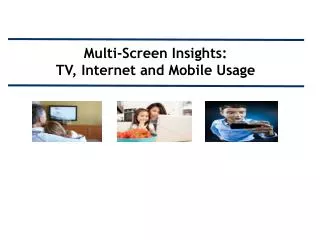
Multi-Screen Insights Digital Video Grows; Still Only Represents A Nominal Share
Multi-Screen Insights Time spent with digital video grows but still only comprises a nominal share - 0:35 with digital video v. 4:17 daily with TV screen among A18-34 Half of all media time is spent with the TV among P18+; majority is with Live TV More and more viewers continue to tune into TV , +1.8 million more v yag among P2+ whereas video viewing on computer is down 4.3 million Television commands over 90% of total video time among main advertiser targets and across most ethnic segments Viewers continue to shift their viewing from computer (-3%) to phone video (+18%) 25 million more consumers used app/web applications in 2Q14; P2+ v yag Households acquired significantly more tablets and enabled smart TVs
Time Spent With Digital Video Is On The Rise But Represents Only A Nominal Share Compared to Time Spent With the TV Screen Daily Time Spent With Digital Video v. TV Screen (Hrs:Min) Source: Nielsen Cross Platform Report 2Q14
A Look At Multicultural Segments: Majority of Time Is Also Spent With The TV Screen Daily Time Spent With Digital Video v. TV Screen Among A18-34 (Hrs:Min) Source: Nielsen Cross Platform Report 2Q14
In Fact, Looking At All Media Consumption, Half Of Consumers Time Is Spent With The Television Avg Time Spent Per Day (Hrs: Min) Among P18+ Source: Nielsen Cross Platform Report 2Q14,P18+
…and Majority Is Spent With Live TV Time Spent Per Day (Hrs:Min) Among P18+ Source: Nielsen Cross Platform Report 2Q14,P18+; usage on each device
How Much Video Content is Consumed Across Each Device?
Mobile Video Smartphone Experienced Growth But Television Still Dominates 92% Of Total Video Time Monthly Video Consumption by Device Watching Television Watching Video on a Computer Watching Video on a Smartphone # of Viewers v. YAG 284 Million +1% 145 Million -3% 114 Million +18% Time Spent (hrs:min) 142:38 10:35 1:41 Source: Nielsen Cross Platform Report 2Q14,P2+;Total video= TV+comp+smartphone
…and Among Both Young and Old, Television Commands Majority of Total Video Monthly Time Spent (Hrs:Min) TVShare Internet Mobile of Total Video TV Video Video P2-11 94%102:546:16 - P1217 93%86:396:20 - P18-24 83%96:5317:012:48 P25-34 88%117:2015:021:56 P35-49 91%138:2712:061:29 P50-64 95%180:568:321:03 P65+ 98%211:553:450:26 Source: Nielsen Cross Platform Report 2Q14,P2+; Total video=TV; internet video and mobile video
In Fact, More and More Consumers Continue To View Video Content On The Television - 1.8 Million More in 2Q14 Number Of User P2+ Viewing TV Source: Nielsen Cross Platform Report 2Q14,P2+
With More Content Readily Available On SmartPhones, Consumers Continue To Shift Some Of Their Video Viewing From Computer To Smartphone Number of Users by Device (P2+)/ Monthly (in OOO’s) 2Q132Q14(+/-) 282,657 284,425 +1,768 149,813145,469-4,344 96,929114,372+17,443 Watching Video on TV Watching Video on a Computer Watching Video on a Smartphone Source: Nielsen Cross Platform Report 2Q14,P2+;
But Despite Video Growth On Smartphone, Time Spent With Mobile Video Remains Nominal - Even Among The Younger Consumers Monthly Time Spent (Hrs:Min) Source: Nielsen Cross Platform Report 2Q14, Total video=TV; internet video and mobile video
With Mobile Growth, App/Web Usage On Smartphone Is Up Considerably As 25 Million More Used The Applications Using Any App/Web On Smartphone (P2+)/ Monthly (in OOO’s) 2Q132Q14‘14 v. YAG 132,235 157,092 +24,857 32:4843:31+33% Number of Users (OOO) P2+ Time Spent P2+/ Month Source: Nielsen Cross Platform Report 2Q14,P2+;
Across All Multicultural Segments Time Spent With App/Web On Smartphones Is High Using Any App/Web On Smartphone (P2+)/ Monthly Composite Black Hispanic Asian Number of Users P2+ (OOO) /Monthly 157,092 19,824 28,772 9,221 (+/-) v. YAG in Number of Users +24,857 +2,830 +4,281 +1,194 Time Spent Monthly/ P2+ 43:31 52:40 49:09 42:43 % Change v. YAG in Time Spent +33% +37% +27% +31% Source: Nielsen Cross Platform Report, P2+; 2Q14
Among Multicultural Segments, Video Consumption Continues To Be Additive Gain/Loss Of Users P2+ 2Q14 v 2Q13 Black Hispanic Asian +648,000 +1,344,000 -624,000 Watching Traditional Television* v. YAG Watching Video on Computer v. YAG +631,000 -991,000 +344,000 +1,954,000 +3,047,000 Video on Smartphone v. YAG +769,000 Source: Nielsen Cross Platform Report, P2+; 2Q14 * includes time-shifted time; **in all TV homes
Over 90% Of Total Video Time Is Spent With The Television Across Most Ethnic Segments TV Share of Total Video Time Spent Monthly Black TV Share Hispanic TV Asian TV Share ShareShare P2-1196%94% 93% P1217 96% 93% 81% P18-2483% 81% 64% P25-3490% 87% 75% P35-4993% 90% 82% P50-6496% 93% 88% P65+ 98% 98% 97% Source: Nielsen Cross Platform Report 2Q14,P2+; Total video=TV; internet video and mobile video
Households Continue To Acquire More & More Tablets and Enabled Smart TV’s Devices in TV HHs (in OOOs) Composite v. YAG DVD/Blue-ray Player 93,707-1% DVR 55,713+5% High Definition TV 100,684+8% Video Game Console 51,470+2% Tablet 42,064+56% Enabled Smart TV 11,688 +89% Source: Nielsen Cross Platform Report 2Q14; P2+