Monte Carlo Simulation
Monte Carlo Simulation. Presented by Megan Aldrich and Tiffany Timm. What is Monte Carlo?. Uses random numbers to generate a simulation to mimic real data Helps find statistics for data that is really messy Use of a computer is required. Discovery and First Use.

Monte Carlo Simulation
E N D
Presentation Transcript
Monte Carlo Simulation Presented by Megan Aldrich and Tiffany Timm
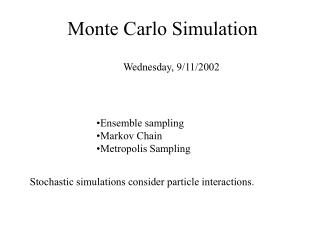
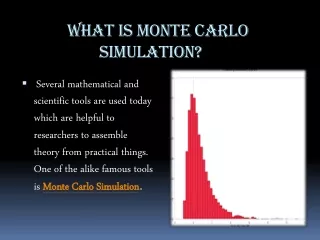
What is Monte Carlo? • Uses random numbers to generate a simulation to mimic real data • Helps find statistics for data that is really messy • Use of a computer is required
Discovery and First Use • First used by Enrico Fermi in 1930s for neutron diffusion • Documented by John von Neumann in the 1940’s during the Manhattan Project of World War II • Popular because gambling was a rising sport and was coined the name Monte Carlo by Neumann’s partner Stainslaw Ulam who loved poker
Pros • Easy to use • Can make the complex data simple • Does not take a lot of time to analyze • Inexpensive
Cons • Original expense to develop and operate simulations can be high • Not sufficient in dealing with small numbers and usually has the operator estimating when this happens
Outline for Monte Carlo • List all possible outcomes for each event. • Determine the probability of each outcome. • Determine subsets of the integers which have the same relative frequencies as the probabilities. • Set up a correspondence between the outcomes and the subsets. • Select a random number. • Using each random number to represent the corresponding event, perform the experiment and note the outcome. • Repeat until desired confidence.
Our Problem As the owner of a small grocery store you have a choice of hiring: • Two cashiers who do their own bagging, and each of whom can check out a shopper in two minutes, or • One cashier and one bagboy who, working as a team, can check out a shopper in one minute. We want to find the best scenario.
Our Problem continued Based on our experience for every one minute: • Zero people get in line 30% of the time • One person gets in line 40% of the time • Two people get in line 30% of the time Using this system we can find the expected wait time per customer and the expected line length they will encounter.
Problem analysis • We generated random numbers in Excel and used a program written by Tiffany to run the experiment • We want to explore: Ho: Mx = My H1: Mx > My
Results • We reject the null hypothesis in favor of the alternative hypothesis. This shows that the average wait time for a one-lane system is longer than a two-lane system. • Therefore, we would choose a two-lane system to effectively lower the wait time for customers.
Questions • Under what circumstances would you use the Monte Carlo Simulation? • Name three ways you can generate random numbers.