Download
1 / 1
20 likes | 145 Vues
3 nodes. 9 nodes. Data point. Tree nodes. Tree edges. 50 nodes. Branching principal components: elastic graphs, topological grammars and metro maps Alexander Gorban (1,3) , Neil Sumner (1) , Andrei Zinovyev (2,3)

E N D
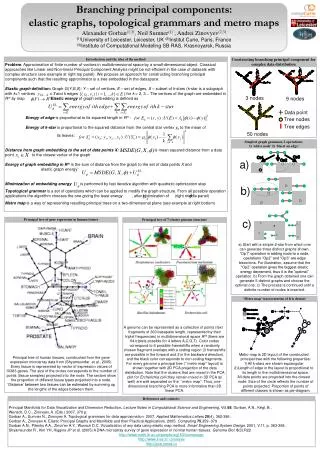
3 nodes 9 nodes Data point Tree nodes Tree edges 50 nodes Branching principal components: elastic graphs, topological grammars and metro maps Alexander Gorban(1,3), Neil Sumner(1) , Andrei Zinovyev(2,3) (1)University of Leicester, Leicester, UK (2)Institut Curie, Paris, France (3)Institute of Computational Modeling SB RAS, Krasnoyarsk, Russia Constructing branching principal component for complex data distribution Introduction and the idea of the method Problem: Approximation of finite number of vectors in multidimensional space by a small-dimensional object. Classical approaches like Linear and Non-linear Principal Component Analysis might be not efficient in the case of datasets with complex structure (see example at right top panel). We propose an approach for constructing branching principal components such that the resulting approximator is a tree embedded in the dataspace. Elastic graph definition: Graph G(Y,E,S): Y – set of vertices, E – set of edges, S – subset of k-stars (k-star is a subgraph with k+1 vertices and k edges ) for k = 2, 3... The vertices of the graph are embedded in Rm by map . Elastic energy of graph embedding is defined as Energy of edge is proportional to its squared length in Rm : Energy of k-star is proportional to the squared distance from the central star vertex y0 to the mean of its leaves: Distance from graph embedding to the set of data points X: is mean squared distance from a data pointto the closest vertex of the graph Energy of graph embedding in Rmis the sum of distance from the graph to the set of data points X and elastic graph energy: Minimization of embedding energy is performed by fast iterative algorithm with quadratic optimization step Topological grammar is a set of operations which can be applied to modify the graph structure. From all possible operation applications the algorithm chooses the one giving the least energy , after optimization of (right middle panel) Metro mapis a way of representing resulting principal trees on a two-dimensional plane (see example at right bottom) Simplest graph grammar, 2 operations: 1) ‘add a node’ 2) ‘bisect an edge’ a) b) c) Principal tree of gene expression in human tissues Principal tree of 7-cluster genome structure Principal tree of human tissues, constructed from the gene expression microarray data from (Shyamsundar et al., 2005). Every tissue is represented by vector of expression values of 10383 genes. The size of the circles corresponds to the number of points (tissue samples) projected into the node. The sectors show the proportion of different tissue types projected into a node. ‘Distance’ between two tissues can be estimated by summing up the lengths of the edges between them. A genome can be represented as a collection of points (text fragments of 300 basepairs length, represented by their triplet frequencies) in multidimensional space R64 (there are 64 triplets possible for 4 letters A,C,G,T). Color codes correspond to 6 possible frameshifts when a randomly chosen fragment overlaps with a coding region (3 frameshifts are possible in the forward and 3 in the backward direction), and the black color corresponds to non-coding fragments. For every genome a principal tree (``metro map'' layout) is shown together with 2D PCA projection of the data distribution. Note that the clusters that are mixed in the PCA plot for Ercherichia coli (they remain mixed in 3D PCA as well) are well separated on the ``metro map''. Thus, one-dimensional branching PCA is more informative than 3D linear PCA. a) Start with a simple 2-star from which one can generate three distinct graphs shown. “Op1” operation is adding node to a node, operations “Op2” and “Op3” are edge bisections. For illustration, assume that the “Op2” operation gives the biggest elastic energy decrement, thus it is the “optimal” operation. b) From the graph obtained one can generate 5 distinct graphs and choose the optimal one. c) The process is continued until a definite number of nodes is inserted. ‘Metro map’ representation of Iris dataset • Metro map is 2D layout of the constructed principal tree with the following properties: • All k-stars are shown equiangular • Length of edge in the layout is proportional to its length in the multidimensional space. • All data points are projected into the closest node. Size of the circle reflects the number of points projected. Proportion of points of different classes is shown as pie-diagram. References and contacts: Principal Manifolds for Data Visualization and Dimension Reduction. Lecture Notes in Computational Science and Engineering, Vol.58. Gorban, A.N., Kégl, B., Wunsch, D.C., Zinovyev, A. (Eds.) 2007, 370 p. Gorban A., Sumner N., Zinovyev A. Topological grammars for data approximation. 2007. Applied Mathematics Letters20(4), 382-386. Gorban A., Zinovyev A. Elastic Principal Graphs and Manifolds and their Practical Applications. 2005. Computing75,359 -379 Gorban A.N., Pitenko A.A., Zinov'ev A.Y., Wunsch D.C. Vizualization of any data using elastic map method. Smart Engineering System Design. 2001, V.11, p. 363-368. Shyamsundar R , Kim YH, Higgins JP et al. (2005) A DNA microarray survey of gene expression in normal human tissues. Genome Biol.6(3):R22 http://www.math.le.ac.uk/people/ag153/homepage/ http://www.ihes.fr/~zinovyev http://pca.narod.ru