Download
1 / 12
120 likes | 263 Vues
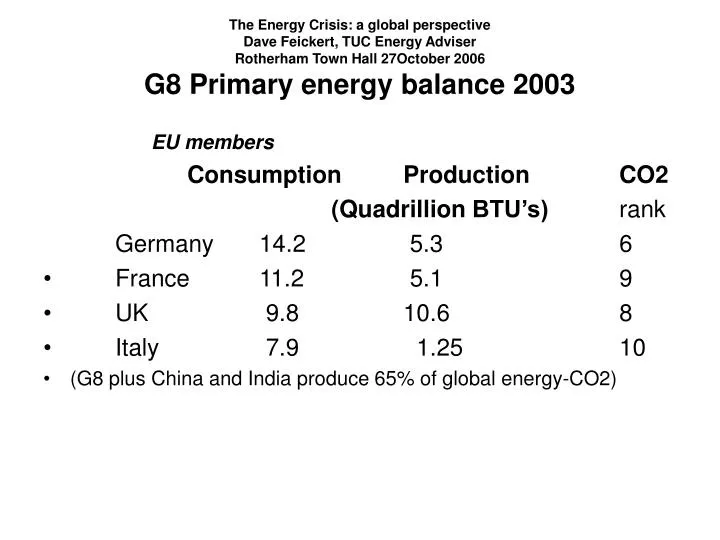
The Energy Crisis: a global perspective Dave Feickert, TUC Energy Adviser Rotherham Town Hall 27October 2006 G8 Primary energy balance 2003. EU members Consumption Production CO2 (Quadrillion BTU’s) rank Germany 14.2 5.3 6 France 11.2 5.1 9 UK 9.8 10.6 8

E N D
The Energy Crisis: a global perspective Dave Feickert, TUC Energy Adviser Rotherham Town Hall 27October 2006G8 Primary energy balance 2003 EU members Consumption Production CO2 (Quadrillion BTU’s) rank Germany 14.2 5.3 6 • France 11.2 5.1 9 • UK 9.8 10.6 8 • Italy 7.9 1.25 10 • (G8 plus China and India produce 65% of global energy-CO2)
Non-EU G8 Consumption Production CO2 (Quadrillion BTU’s) Rank USA 98.8 70.5 1 • Japan 22.4 3.9 4 • Canada 13.8 18.4 7 • Russia 29.0 49.2 3 China 2 India 5 • (Source: US Department of Energy, Energy Information and Analysis for 2003. There are 23.36 mtoe per quadrillion btu)
Increasing energy consumption and CO2 emissions to 2030 – EU and IEA baseline scenarios • EU primary energy needs increase 14.6% from 1654 mtoe in 2000 to 1895 mtoe in 2030 • IEA predicts a 60% increase in energy needs globally by 2030 • Global CO2 emissions increase by 50% • To prevent the planet warming a further 2 deg C by 2050, CO2 emissions must be cut by 60% at least
World energy-related CO2 Emissions - some key issues • Developing countries overtake OECD CO2 emissions in the 2020s • China is presently second after the US but will become the largest emitter • On a per capita basis the OECD will still be twice that of China
Examples of key EU policies by sector • Industry and power generation: renewable energy directive, CHP directive, ETS • Transport: prolongation of ACEA voluntary agreement, biofuels target • Residential and commercial: eco-design, energy performance in buildings directive
Alternative scenarios to 2030cases examined for the EU • Renewable energy – 12% by 2010, further doubling to 2030 • Energy efficiency – 20% improvement by 2020 • Carbon capture and storage on all major fossil plant by 2050 • Emissions trading scheme with increasing carbon values for a CO2 reduction target of 30% by 2020 on 1990 levels • Nuclear replacement and expansion in ‘nuclear’ member states
UK CO2 emissions 1970 – 2002 million tonnes carbon (DEFRA) 1. By source 1970 1990 2002 Power stations 57.0 54.1 43.0 Industry Power Gen 44.6 21.9 19.1 Domestic 26.5 21.5 23.8 Road transport 16.3 29.7 31.9
UK CO2 emissions 1970 – 2002 million tonnes carbon (DEFRA) 2. By fuel type 1970 1990 2002 • Coal 78.9 58.2 31.3 • Natural gas 3.2 30.4 56.5 • Road fuels 16.5 29.9 32.0
Rising coal consumption 1983-2003 mtoe 1983 2003 North America 527.4 612.7 Europe and Eurasia 636.2 535.9 Asia Pacific 904.2 1306.2 Africa 78.1 97.2 WORLD 2168.1 2578.4 (BP statistical review of world 2004)
Clean coal technologies increase thermal efficiency and reduce emissions • Stack gas treatment - FGD • Advanced pulverised fuel (PF) combustion ( e.g.supercritical boilers) • Fluidised bed combustion (FBC) • Integrated gasification combined cycle (IGCC) • Hybrid and advanced systems • Hydrogen plants
Carbon capture and storage • CO2 already routinely captured • New techniques needed to reduce costs • Pumped into exhausted oil/gas reservoirs • Can enhance oil recovery and methane recovery in coal seams • Only certain geological formations suitable • Sir David King has recently asked the Chinese Government to fit CO2 capture technology to new power stations
China • 35% of world coal production • Coal makes up 70% of energy needs • Output up from 929 m tne (2001) to 2.1bn tne (2005) • Expected to increase to 2.4 bn tne by 2011 • But has 80% of world’s supercritical boilers, partly developed in the UK. UK has none.