Download
1 / 3
30 likes | 167 Vues
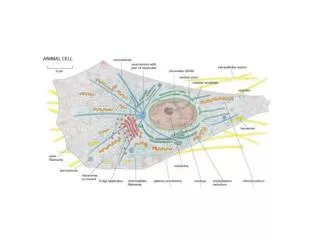
A. B. 120. 1. 2. 3. 4. 5. 6. prhTRAL. prhTRAL. c rhTRAL. c rhTRAL. 100. 80. Protein standard Whole cell lysate Cytosolic fraction Ni + -NTA affinity column Polymixin B Sepharose column PD-10 desalting column . 60. Cell viability (%). 40. 20. 0. 0. 50. 100. 150.

E N D
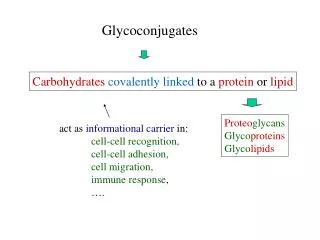
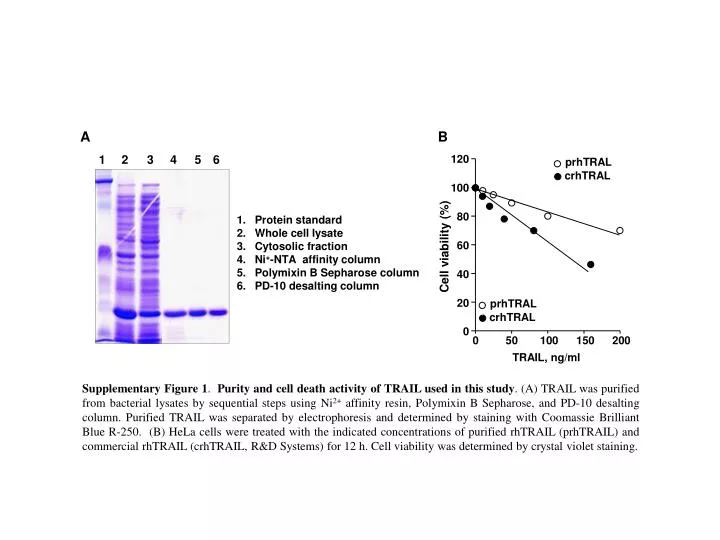
A B 120 1 2 3 4 5 6 prhTRAL prhTRAL crhTRAL crhTRAL 100 80 • Protein standard • Whole cell lysate • Cytosolic fraction • Ni+-NTA affinity column • Polymixin B Sepharose column • PD-10 desalting column 60 Cell viability (%) 40 20 0 0 50 100 150 200 TRAIL, ng/ml Supplementary Figure 1. Purity and cell death activity of TRAIL used in this study. (A) TRAIL was purified from bacterial lysates by sequential steps using Ni2+ affinity resin, Polymixin B Sepharose, and PD-10 desalting column. Purified TRAIL was separated by electrophoresis and determined by staining with Coomassie Brilliant Blue R-250. (B) HeLa cells were treated with the indicated concentrations of purified rhTRAIL (prhTRAIL) and commercial rhTRAIL (crhTRAIL, R&D Systems) for 12 h. Cell viability was determined by crystal violet staining.
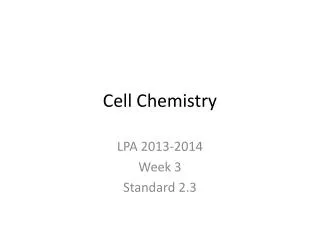
B A 120 100 Necrotic apoptosis Necrosis Apoptosis Survival 100 80 80 60 60 Cell viability (%) Cell population (%) 40 40 20 prhTRAL 20 crhTRAL 0 0 50 100 150 200 0 TRAIL, ng/ml TRAIL VEGF - - + - + + Supplementary Figure 2. TRAIL does not induce endothelial cell death. (A) HUVECs were treated with the indicated concentrations of TRAIL for 24 h. Cell viability was determined by crystal violet staining.(B) HUVECs were treated 200 ng/ml of TRAIL for 12 h. Apoptosis and necrosis were determined after staining with PI and Annexin V-FITC by FACS analysis. Data shown in graphs are the means SD (n = 4).
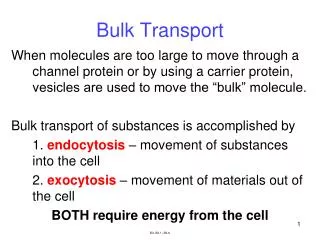
siFAK FRNK Mock FAK FRNK Supplementary Figure 3. Expressional levels of FAK and FRNK. HUVECs were transfected with FRNK-expressing vector or FAK siRNA using lipofectamine 2000 and LipofectamineRNAi Max, and cell lysates were subjected to Western blot analysis.