Understanding Maximum Likelihood Estimates and EM Algorithms in R
580 likes | 702 Vues
This document introduces Maximum Likelihood Estimates and the Expectation-Maximization (EM) algorithms, providing a computation toolkit using R, C/C++, and Fortran. It offers step-by-step guidance on installing R, loading packages, and utilizing various mathematical operators. You'll learn how to define your own functions and manage data files, including reading from and writing to CSV/TXT formats. The document also features practical examples, especially in genetics, to illustrate the concepts effectively, making it a great resource for statisticians and data analysts.

Understanding Maximum Likelihood Estimates and EM Algorithms in R
E N D
Presentation Transcript
Maximum Likelihood Estimates and the EM Algorithms I Henry Horng-Shing Lu Institute of Statistics National Chiao Tung University hslu@stat.nctu.edu.tw
Computation Tools • R (http://www.r-project.org/): good for statistical computing • C/C++: good for fast computation and large data sets • More: http://www.stat.nctu.edu.tw/subhtml/source/teachers/hslu/course/statcomp/links.htm
The R Project • R is a free software environment for statistical computing and graphics. It compiles and runs on a wide variety of UNIX platforms, Windows and MacOS. • Similar to the commercial software of Splus. • C/C++, Fortran and other codes can be linked and called at run time. • More: http://www.r-project.org/
Install R Double click R-icon to install R
Execute R Interactive command window
Choose a Mirror Site Choose a mirror site close to you 1. 2.
Select One Package to Download Choose one package to download, like rgl. 1. 2.
Load Packages • There are two methods to load packages: Method 1: Click from the menu bar Method 2: Type “library(rgl)” in the command window
Help in R (1) • What is the loaded library? • help(rgl)
Help in R (2) • How to search functions for key words? • help.search(“key words”) It will show all functions has the key words. • help.search(“3D plot”) Function name (belong to which package) description
Help in R (3) • How to find the illustration of function? • ?function name It will show the usage, arguments, author, reference, related functions, and examples. • ?plot3d
R Operators (1) • Mathematic operators: • +, -, *, /, ^ • Mod: %% • Sqrt, exp, log, log10, sin, cos, tan, …
R Operators (2) • Other operators: • : sequence operator • %*% matrix algebra • <, >, <=, >= inequality • ==, != comparison • &, &&, |, || and, or • ~ formulas • <-, = assignment
Algebra, Operators and Functions > 1+2 [1] 3 > 1>2 [1] FALSE > 1>2|2>1 [1] TRUE > A=1:3 > A [1] 1 2 3 > A*6 [1] 6 12 18 > A/10 [1] 0.1 0.2 0.3 > A%%2 [1] 1 0 1 > B=4:6 > A*B [1] 4 10 18 > t(A)%*%B [1] [1] 32 > A%*%t(B) [1] [2] [3] [1] 4 5 6 [2] 8 10 12 [3] 12 15 18 > sqrt(A) [1] 1.000 1.1414 1.7320 > log(A) [1] 0.000 0.6931 1.0986 > round(sqrt(A),2) [1] 1.00 1.14 1.73 > ceiling(sqrt(A)) [1] 1 2 2 > floor(sqrt(A)) [1] 1 1 1 > eigen(A%*%t(B)) $values [1] 3.20e+01 5.83e-16 2.48e-16 $vectors [1] [2] [3] [1] 0.2672 0.3273 -0.8890 [2] 0.5345 -0.5217 0.2530 [3] 0.8017 0.4665 0.3810
Define Your Own Function (1) • Use “fix(myfunction)” # a window will show up • function (parameter){ statements; return (object); # if you want to return some values } • Save the document • Use “myfunction(parameter)” in R
2. 3. 1. Define Your Own Function (2) • Example: Find all the factors of an integer
Define Your Own Function (3) • When you leave the program, remember to save the work space for the next use, or the function you defined will disappear after you close R project.
Read and Write Files • Write Data to a CSV File • Write Data to a TXT File • Read TXT and CSV Files • Demo
Write Data to a TXT File • Usage: write(x,file,…) > X=matrix(1:6,2,3) > X [,1] [,2] [,3] [1,] 1 3 5 [2,] 2 4 6 > write(t(X),file=“d:/out2.txt”,ncolumns=3) > write(X,file=“d:/out3.txt”,ncolumns=3) d:/out2.txt 1 3 5 2 4 6 d:/out3.txt 1 2 3 4 5 6
Write Data to a CSV File • Usage: write.table(x,file=“foo.csv”,sep=“,”,…) > X=matrix(1:6,2,3) > X [,1] [,2] [,3] [1,] 1 3 5 [2,] 2 4 6 >write.table(t(X),file=“d:/out4.txt”,sep=“,”,col.names=FALSE,row.names=FALSE) >write.table(X,file=“d:/out5.txt”,sep=“,”,col.names=FALSE,row.names=FALSE) d:/out4.txt 1,2 3,4 5,6 d:/out5.txt 1,3,5 2,4,6
Read TXT and CSV Files • Usage: read.table(file,...) > X=read.table(file="d:/out2.txt") > X v1 v2 v3 1 1 3 5 2 2 4 6 > Y=read.table(file="d:/out5.txt",sep=",",header=FALSE) > Y V1 V2 1 1 2 2 3 4 3 5 6
Demo > Data=read.table(file="d:/01.csv",header=TRUE,sep=",") >Data Y X1 X2 1 2.651680 13.808990 26.75896 2 1.875039 17.734520 37.89857 3 1.523964 19.891030 26.03624 4 2.984314 15.574260 30.21754 5 10.423090 9.293612 28.91459 6 0.840065 8.830160 30.38578 7 8.126936 9.615875 32.69579 >mean(Data$Y) [1] 4.060727 >boxplot(Data$Y) 01.csv
A a b B A b a A a A a b B B B b Example 1 in Genetics (1) • Two linked loci with alleles A and a, and B and b • A, B: dominant • a, b: recessive • A double heterozygote AaBb will produce gametes of four types: AB, Ab, aB, ab F ( Female) 1- r’ r’ (female recombination fraction) M (Male) 1-r r (male recombination fraction)
Example 1 in Genetics (2) • r and r’ are the recombination rates for male and female • Suppose the parental origin of these heterozygote is from the mating of . The problem is to estimate r and r’ from the offspring of selfed heterozygotes. • Fisher, R. A. and Balmukand, B. (1928). The estimation of linkage from the offspring of selfed heterozygotes. Journal of Genetics, 20, 79–92. • http://en.wikipedia.org/wiki/Geneticshttp://www2.isye.gatech.edu/~brani/isyebayes/bank/handout12.pdf
A a b B 1/2 1/2 1/2 1/2 a A a a A A b B b b B B A A a a A a A a b b B b b B B B Example 1 in Genetics (3)
Example 1 in Genetics (5) • Four distinct phenotypes: A*B*, A*b*, a*B* and a*b*. • A*: the dominant phenotype from (Aa, AA, aA). • a*: the recessive phenotype from aa. • B*: the dominant phenotype from (Bb, BB, bB). • b* : the recessive phenotype from bb. • A*B*: 9 gametic combinations. • A*b*: 3 gametic combinations. • a*B*: 3 gametic combinations. • a*b*: 1 gametic combination. • Total: 16 combinations.
Example 1 in Genetics (7) Hence, the random sample of n from the offspring of selfed heterozygotes will follow a multinomial distribution:
Example 1 in Genetics (8) Suppose that we observe the data of y = (y1, y2, y3, y4) = (125, 18, 20, 24), which is a random sample from Then the probability mass function is
Estimation Methods • Frequentist Approaches: http://en.wikipedia.org/wiki/Frequency_probability Method of Moments Estimate (MME) http://en.wikipedia.org/wiki/Method_of_moments_%28statistics%29 Maximum Likelihood Estimate (MLE) http://en.wikipedia.org/wiki/Maximum_likelihood • Bayesian Approaches: http://en.wikipedia.org/wiki/Bayesian_probability
Method of Moments Estimate (MME) • Solve the equations when population means are equal to sample means: for k = 1, 2, …, t, where t is the number of parameters to be estimated. • MME is simple. • Under regular conditions, the MME is consistent! • More: http://en.wikipedia.org/wiki/Method_of_moments_%28statistics%29
MME for Example 1 Note: MME can’t assure
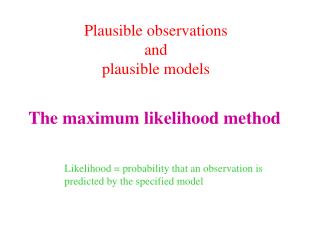
Maximum Likelihood Estimate (MLE) • Likelihood: • Maximize likelihood: Solve the score equations, which are setting the first derivates of likelihood to be zeros. • Under regular conditions, the MLE is consistent, asymptotic efficient and normal! • More: http://en.wikipedia.org/wiki/Maximum_likelihood
Example 2 (1) We toss an unfair coin 3 times and the random variable is If p is the probability of tossing head, then
Example 2 (2) Suppose we observe the toss of 1 heads and 2 tails, the likelihood function becomes One way to maximize this likelihood function is by solving the score equation, which sets the first derivative to be zero:
Example 2 (3) • The solution of p for the score equation is 1/3 or 1. • One can check that p=1/3 is the maximum point. (How?) • Hence, the MLE of p is 1/3 for this example.
A B C MLE for Example 1 (1) • Likelihood • MLE:
MLE for Example 1 (2) • Checking: (1) (2) (3)