Maximum Likelihood Estimation
Maximum Likelihood Estimation. Multivariate Normal distribution. The Method of Maximum Likelihood . Suppose that the data x 1 , … , x n has joint density function f ( x 1 , … , x n ; q 1 , … , q p )


Maximum Likelihood Estimation
E N D
Presentation Transcript
Maximum Likelihood Estimation Multivariate Normal distribution
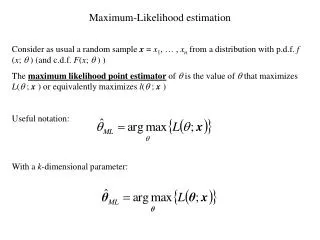
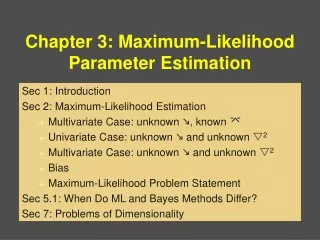
The Method of Maximum Likelihood Suppose that the data x1, … , xnhas joint density function f(x1, … , xn; q1, … , qp) where q = (q1, … , qp) are unknown parameters assumed to lie in W(a subset of p-dimensional space). We want to estimate the parametersq1, … , qp
Definition: The Likelihood function Suppose that the data x1, … , xnhas joint density function f(x1, … , xn; q1, … , qp) Then given the data the Likelihood function is defined to be = L(q1, … , qp) = f(x1, … , xn; q1, … , qp) Note: the domain of L(q1, … , qp) is the set W.
Definition: Maximum Likelihood Estimators Suppose that the data x1, … , xnhas joint density function f(x1, … , xn; q1, … , qp) Then the Likelihood function is defined to be = L(q1, … , qp) = f(x1, … , xn; q1, … , qp) and the Maximum Likelihood estimators of the parameters q1, … , qp are the values that maximize = L(q1, … , qp)
i.e. the Maximum Likelihood estimators of the parameters q1, … , qp are the values Such that Note: is equivalent to maximizing the log-likelihood function
The Multivariate Normal Distribution Maximum Likelihood Estiamtion
denote a sample (independent) Let from thep-variate normal distribution with mean vector and covariance matrix Note:
The matrix is called the data matrix.
The vector is called the data vector.
The vector is called the sample mean vector note
Graphical representation of sample mean vector The sample mean vector is the centroid of the data vectors.
There are different ways of representing sample covariance matrix:
Maximum Likelihood Estimation Multivariate Normal distribution
denote a sample (independent) Let from thep-variate normal distribution with mean vector and covariance matrix Then the joint density function of is:
The Likelihood function is: and the Log-likelihood function is:
To find the Maximum Likelihood estimators of we need to find to maximize or equivalently maximize
Note: thus hence
Summary: the Maximum Likelihood estimators of are and
Note is: The joint density function of
Thus the distribution of is p-variate normal with mean vector
Summary The sampling distribution of is p-variate normal with
The sampling distribution of the sample covariance matrix S and
The Wishart distribution A multivariate generalization of the c2 distribution
Definition: the p-variate Wishart distribution be k independent random p-vectors Let Each having a p-variate normal distribution with Then U is said to have the p-variate Wishart distribution with k degrees of freedom
The density ot the p-variate Wishart distribution Then the joint density of U is: Suppose where Gp(·) is the multivariate gamma function. It can be easily checked that when p = 1 and S = 1 then the Wishart distribution becomes the c2 distribution with k degrees of freedom.
Theorem Suppose then Corollary 1: Corollary 2: Proof
Theorem are independent, then Suppose Theorem are independent and Suppose then
Theorem Let be a sample from then Theorem Let be a sample from then
Theorem Proof etc
Theorem Let be a sample from then is independent of Proof be orthogonal Then
This the distribution of is np-variate normal with mean vector
Thus the joint distribution of is np-variate normal with mean vector
Thus the joint distribution of is np-variate normal with mean vector