SlideServe
Menu
Préférences
© SlideServe · v2026

Path Analysis and Maximum Likelihood Estimation: Steps to Model Causal Relationships

elaine-hunt avatar
8 diapositives · 231 Views · Nov 29, 2014

This document outlines the critical steps for conducting path analysis and applying maximum likelihood estimation to model complex causal relationships among variables. Beginning with the formulation of a causal model, it guides you through translating this model into structured equations, deriving predicted variances and covariances, estimating free parameters, and evaluating the goodness-of-fit of the model. Key concepts such as exogenous and endogenous variables are discussed, alongside techniques for minimizing differences between observed and predicted data. Finally, statistical significance tests are outlined for model validation.
Path Analysis and Maximum Likelihood Estimation: Steps to Model Causal Relationships - slide 1
01 / 8Path Analysis and Maximum Likelihood Estimation: Steps to Model Causal Relationships
1 / 17

Télécharger la présentation

Path Analysis and Maximum Likelihood Estimation: Steps to Model Causal Relationships
Une image / un lien ci-dessous est fourni (tel quel) pour télécharger la présentation

Politique de téléchargement : le contenu du site vous est fourni TEL QUEL pour votre information et votre usage personnel ; il ne peut être vendu, concédé sous licence ni partagé sur d’autres sites sans l’accord de son auteur.Le contenu vous est fourni TEL QUEL, pour votre information et votre usage personnel uniquement. Téléchargez la présentation en cliquant sur ce lien. Lors du téléchargement, si vous ne parvenez pas à télécharger une présentation, l’éditeur a peut-être supprimé le fichier de son serveur.Pendant le téléchargement, si vous ne parvenez pas à obtenir une présentation, le fichier a peut-être été supprimé par l’éditeur.

F I N

Plus de contenu associé

Transcription de la présentation
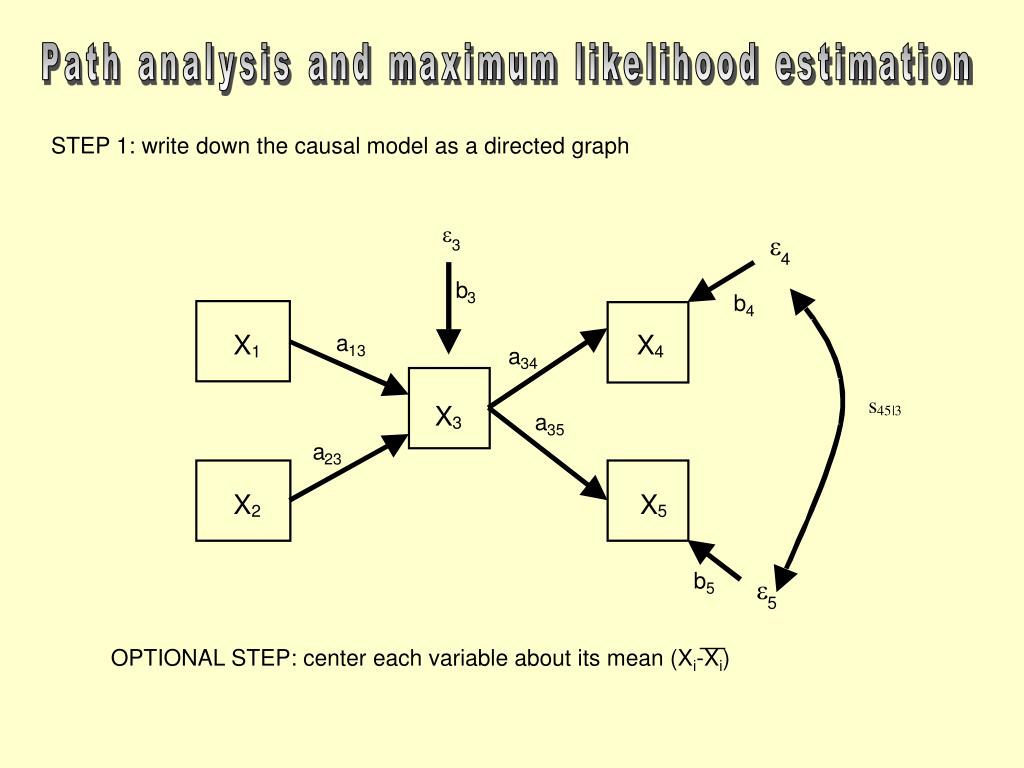
  1. e e 3 4 b 3 b 4 X X a 1 13 4 a 34 s X 45 |3 a 3 35 a 23 X X 2 5 b e 5 5 OPTIONAL STEP: center each variable about its mean (Xi-Xi) Path analysis and maximum likelihood estimation STEP 1: write down the causal model as a directed graph

  2. e e 3 4 b 3 b 4 X X a 1 13 4 a 34 s X 45 |3 a 3 35 a 23 X X 2 5 b e 5 5 Path analysis and maximum likelihood estimation Exogenous variables: variables that have no explicit causes in the model Endogenous variables: variables that are caused by other variables in the model

  3. free parameter e e 3 4 b 3 b 4 X X a 1 13 4 a 34 s X 45 |3 a 3 35 a 23 X X 2 5 b e 5 5 Path analysis and maximum likelihood estimation STEP 2: translate this to a series of structured equations with free parameters X1=N(0,) 3=N(0,1) 5=N(0,1) X2=N(0,) 4=N(0,1) X3=a13X1+a23X2+b33 X4=a34X3+b44 X5=a35X3+b55 Cov(X1,X2)=Cov(X1,3)=Cov(X1, 4)=Cov(X1, 5)= Cov(X2,3)=Cov(X2, 4)=Cov(X2, 5)= Cov(3,4)=Cov(3, 5)=0 Cov(4, 5)=45

  4. X1 X2 X3 X4 X5 X1 S1 0 a13S1 a13a34S1 a23a35S1 X2 S2 a23S2 a13a34S2 a23a35S2 X3 S3 a34S3 a35S3 X4 S4 a23S3+ b4b5Cov(4,5) X5 S5 = Path analysis and maximum likelihood estimation STEP 3: Derive the predicted variance and covariance between each pair of variables in the model, respecting the constraints implied by the causal graph, using covariance algebra.

  5. Observed variances & covariances (S) Predicted variances & covariances ((free)) Path analysis and maximum likelihood estimation STEP 4: Estimate the free parameters by minimizing the difference between the observed and predicted variances and covariances. Maximum likelihood estimation Estimates of the free parameters (path coefficients,error variances, free covariances) that make the predicted covariance matrix() as close as possible to the observed variances and covariances, while respecting the constraints required by d-separation (I.e. the causal structure).

  6. Path analysis and maximum likelihood estimation STEP 6: Look at the remaining differences between the observed and predicted covariance matrices, and calculate the probability of having observed this difference, assuming that these differences should be the same except for random sampling variation. X2ML (maximum likelihood chi-square statistic) degrees of freedom = V(V+1)/2 - #free parameters STEP 7: If the calculated probability is less than the chosen significance level (eg 0.05) then the data did not come from this causal process, and the model must be rejected; otherwise the data support the model.

  7. Path analysis and maximum likelihood estimation Now, let's do some analyses... Using the EQS program

  8. A B D C Path analysis and maximum likelihood estimation Overall association between X and Y Effects of causal ancestors on causal descendents Effects due to a common causal ancestor Unresolved causal relationships Direct effects Indirect effects