Download
1 / 13
130 likes | 275 Vues
OIB Land Ice Team Meeting. GSFC Jan 26-27, 2012 . January 26, Thursday OIB 0830 Guidance from HQ (Wagner) 0900 Final Flight selection and prioritization (all with status summary from Sonntag/ Hofton / Jezek at beginning and end of session) Thursday PM

E N D
OIB Land Ice Team Meeting GSFC Jan 26-27, 2012
January 26, Thursday OIB • 0830 Guidance from HQ (Wagner) 0900 Final Flight selection and prioritization (all with status summary from Sonntag/Hofton/Jezek at beginning and end of session) • Thursday PM • Discussion sessions initiated with a couple of vu-graphs from sub groups to address approaches/strategies/schedules/resources for vetting data, verifying data applicability to science goals, future instrument developments, etc. • 1200 Lunch • 1300 Surface Elevation and Elevation Change (Krabill, Blair, Smith, Csatho, Young) • 1400 Ice thickness/Bathymetry (Paden, Cochran, Bell, Rignot) • 1500 Break • 1530 Detailed Surface and Bed Imaging (Wu, Paden, Jezek, Fahnestock, Dominguez) • 1630 Accumulation (Leuschen, Joughin) 1730 End • January 27 Friday AM • 0830 Extending Coverage and Platform Availability (Luthcke, Studinger, Sonntag, Albertson) • 0930 Integration with Models including data scientific utiility, data accuracy, data formats, availability, and product specs (Laroar, Nowicki, Kaminski, Plummer) • 1030 Break • 1100 White paper Summary and updates (Jezek, Studinger) • * What have we accomplished in Greenland and what do we need to do • * What have we accomplished in Antartica and where are the new targets • * Given high/fast, low/slow UAVs what could we do and what would we do differently • 1200 Lunch • 1300 Round table discussion between land ice and instrument teams to refine future directions • 1500 End
Flight Line Prioritization and Check List • LVIS B-200/Falcon 1) SE Center lines that Bea proposed last year 2) Segments that repeat ICESat/DC-8/P-3 tracks 3) Segments near-terminus, 1000, 2000, 2500, and 3000 m contours 3) Assuming good data from blocks last year, then move north 4) Blocks in Central west and Northwest have higher priority than Central East and North East 5) Blocks in the far north (eg Peterman and East) have lowest priority 6) Any transit flights should attempt to fly along a flow line towards the divide and then an opposing flow line away from the divide. • Alaska: Present ensemble plus: • Harding Icefield • Nebesna Glacier and icefield • Alaska Range • P-3 • Sonntag Summary
Surface Elevation and dh/dt • Is Luthcke/Jezek acquisition strategy working? • Optimizing multiple platforms • Data quality and multiple data stream integration • Products, product definitions, formats, metadata • Science goals reached; science goals to focus on
Ice thickness/Bathymetry/Geology • Where does radar work? • Where does gravity work? • Are magnetics mature enough to specify a derived product? • Do we need course corrections? • Are we missing new technologic ideas (radar improvement/slower long duration platforms)? • Data quality, product definition, format • What science has been accomplished • What science should we focus on
Surface and Bed Imaging • Do we need tomography and if so where and why? • Where can we expect tomography to work? • Can we accommodate tomography and nadir sounding? • What is the plan for merging tomography algorithms? • How do we optimize surface imaging and DEM construction with altimeters, radar and DMS? • What are the data products, formats and specs (surface DEM, base DEM, surface radar intensity image, base radar intensity image, photography • What science has been accomplished and where should we focus
Why Tomography • Only practical way to get dense bedrock elevations near the grounding line (Antarctic Science Requirement) • Directly links basal and surface radar intensity to topographies (clues to water) • Key insight into active geomorphologic processes (e.g. megagrooves) • Potential for imaging structures within the ice volume (moulins)
Accumulation rate • Where do we stand with routinely extracting accumulation rate? • What are the accumulation accuracies? • What is the temporal averaging for accumulation rate • What will an accumulation product look like?
Extending Coverage and Platforms • Where do we need to extend coverage? • Do we need to increase temporal resolution? If so, where and by how much? • What instruments are required in Antarctica? In Greenland? • Should there be one suite of instruments? • How do we judge whether to shift focus from Greenland to Antarctica?
Integration with Models • What is the data product suite? • Is the suite adequate for modeling? Are there data-type gaps? • Are formats suitable and metadata adequate for modeling • How well are data from campaigns being used in models to inform next planning cycle? • What science has been accomplished with predictive models and where should we focus.
White Paper and Requirements • Strategy Paper on web • What have we accomplished in Greenland and what do we need to do • What have we accomplished in Antartica and where are the new targets • Given high/fast, low/slow UAVs what could we do and what would we do differently • Science Requirements • Should we specify requirement tolerance and to which items • Success Criteria • Cumulative maps showing successful data acquisition
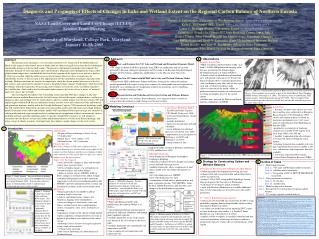
OIB Land Ice Phase 3-4 Strategy • Phase 1 (2008-2010): OIB demonstrated successful, spatially extensive data collections in both the Arctic and Antarctic • Phase 2 (2010-11): Rigorous science requirements adopted for planning and mission success analysis • Phase 3 (2012 – 2015) • Vet data for utility for solving science problems; • increase spatial and temporal coverage (UAVs); • Adopt advanced technologies (e.g. tomography); • develop an end-to-end vision that emphasizes rapid model/process output for resolution of key science questions • Phase 4 (2015-2020) • Acquire I-2 prelaunch data to assure quick continuity of dh/dt record • One post launch campaign in Arctic and Antarctic to assure continuity • Continued focused missions that • Utilize flexibility of airborne platforms • Combine in situ, airborne and spaceborne observation to increase confidence in interpretation • Maintain crucial instruments that are still unique to airborne platforms • Respond to unique, transient geophysical phenomena • http://bprc.osu.edu/rsl/IST/index_files/PROJECTDOCUMENTS.htm Tomographic image of Russel Glacier Courtesy of JPL, KU and OSU. Image compilation of 2011 Pine Island Glacier rift courtesy of M. Studinger.
Science Requirement Clarification • IS8 Measure ice thickness, gravity, surface, and bed elevation along central flowlines of the outlet glaciers in Greenland with terminus widths of 2 km or greater1. Measurements should extend at least 1.5 times farther than predicted outlet glacier valley dimensions. Repeat surface elevation measurements as practical. • IS 9 Measure once, ice thickness, surface, and bed elevation across-flow transects at 3- and 8-km upstream of the terminus for each glacier in (8). Repeat surface elevation measurements as practical.