Mahnomen County Crash Data Overview: Insights on Total and Severe Crashes
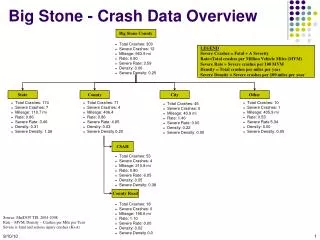
This overview provides a detailed analysis of crash data in Mahnomen County, covering key statistics from 2004 to 2009. A total of 258 crashes were reported, with 27 classified as severe. The severity rate stands at 7.2 per 100 million vehicle miles, while crash density is 0.1 per mile. The data reveals variations in crash occurrences across different road types, including state roads, county roads, and urban areas. These insights are crucial for improving road safety and minimizing severe accidents in the region.


Mahnomen County Crash Data Overview: Insights on Total and Severe Crashes
E N D
Presentation Transcript
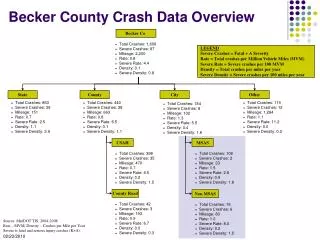
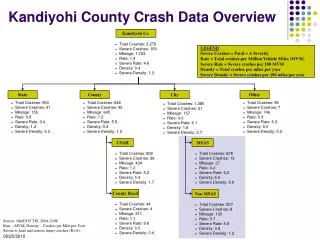
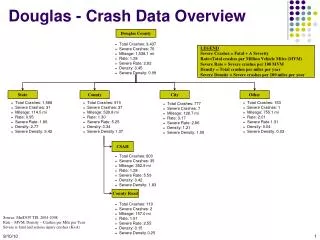
Mahnomen County Crash Data Overview Mahnomen Co • Total Crashes: 258 • Severe Crashes: 27 • Mileage: 758 • Rate: 0.7 • Severe Rate: 7.2 • Density: 0.1 • Severe Density: 0.7 • Total Crashes: 164 • Severe Crashes: 15 • Mileage: 73 • Rate: 0.7 • Severe Rate: 6.5 • Density: 0.4 • Severe Density: 4.1 LEGEND Severe Crashes = Fatal + A Severity Rate = Total crashes per Million Vehicle Miles (MVM) Severe Rate = Severe crashes per 100 MVM Density = Total crashes per miles per year Severe Density = Severe crashes per 100 miles per year State County City Other • Total Crashes: 66 • Severe Crashes: 8 • Mileage: 281 • Rate: 0.6 • Severe Rate: 7.3 • Density: 0.0 • Severe Density: 0.6 • Total Crashes: 11 • Severe Crashes: 4 • Mileage: 391 • Rate: 0.5 • Severe Rate: 17.3 • Density: 0.0 • Severe Density: 0.2 • Total Crashes: 17 • Severe Crashes: 0 • Mileage: 13 • Rate: 1.7 • Severe Rate: 0.0 • Density: 0.3 • Severe Density: 0.0 CSAH MSAS • Total Crashes: 57 • Severe Crashes: 6 • Mileage: 194 • Rate: 0.6 • Severe Rate: 6.1 • Density: 0.1 • Severe Density: 0.6 • Total Crashes: - • Severe Crashes: - • Mileage: - • Rate: - • Severe Rate: - • Density: - • Severe Density: - County Road Non MSAS • Total Crashes: 9 • Severe Crashes: 2 • Mileage: 87 • Rate: 0.8 • Severe Rate: 18.2 • Density: 0.0 • Severe Density: 0.5 • Total Crashes: 17 • Severe Crashes: 0 • Mileage: 13 • Rate: 1.7 • Severe Rate: 0.0 • Density: 0.3 • Severe Density: 0.0 Source: Mn/DOT TIS, 2004-2008 Rate – MVM, Density – Crashes per Mile per Year Severe is fatal and serious injury crashes (K+A).
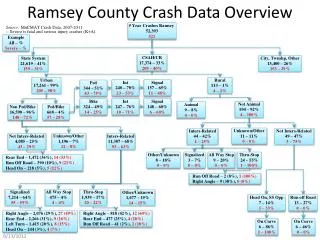
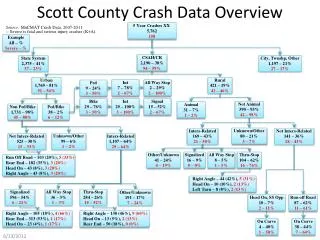
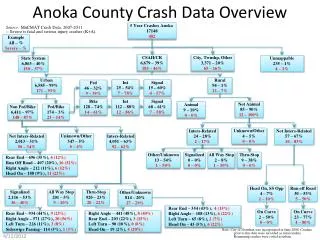
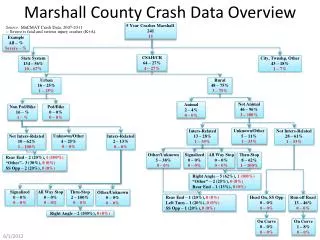
Mahnomen County Crash Data Overview Source: MnCMAT Crash Data, 2005-2009 Severe is fatal and serious injury crashes (K+A). 5 Year Crashes Mahnomen Co 257 26 Example All – % Severe – % State System 164 – 64% 15 – 58% CSAH/CR 65 – 25% 7 – 27% City, Twnshp, Other 28 – 11% 4 – 15% Rural 62 – 95% 7 – 100% Urban 3 – 5% 0 – 0% Animal 10 – % 0 – % Not Animal 52 – % 7 – % Unknown/Other 2 – 67% 0 – 0% Not Inters-Related 0 – 0% 0 – 0% Inters-Related 1 – 33% 0 – 0% Unknown/Other 6 – 12% 2 – 29% Inters-Related 13 – 25% 1 – 14% Not Inters-Related 33 – 63% 4 – 57% Other/Unknown 1 – 100% 0 – 0% Other/Unknown 11 – 85% 1 – 100% Signalized 0 – 0% 0 – 0% All Way Stop 0 – 0% 0 – 0% Thru-Stop 2 – 15% 0 – 0% Head On, SS Opp 3 – 9% 1 – 25% Run off Road 23 – 70% 2 – 50% Run Off Road – 5 (45%),1 (100%) Left Turn – 2 (18%), 0 (0%) Sideswipe Same – 1 (9%),0 (0%) Sideswipe Opp – 1 (9%),0(0%) On Curve 1 – 33% 1 – 100% On Curve 12 – 52% 2 – 100% Right Angle – 1 (50%),0 (0%) Rear End – 1 (50%), 0 (0%)