Big Stone - Crash Data Overview
Big Stone - Crash Data Overview. Big Stone County. Total Crashes: 300 Severe Crashes: 12 Mileage: 963.9 mi Rate: 0.90 Severe Rate: 3.59 Density: 0.06 Severe Density: 0.25. Total Crashes: 174 Severe Crashes: 7 Mileage: 110.7 mi Rate: 0.86 Severe Rate: 3.46 Density: 0.31

Big Stone - Crash Data Overview
E N D
Presentation Transcript
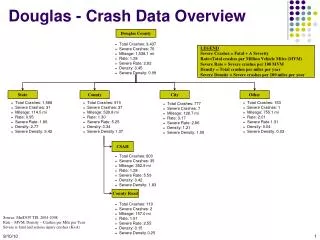
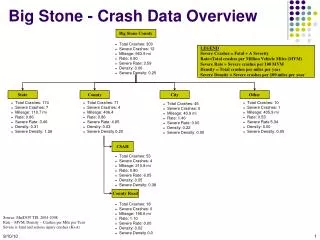
Big Stone - Crash Data Overview Big Stone County • Total Crashes: 300 • Severe Crashes: 12 • Mileage: 963.9 mi • Rate: 0.90 • Severe Rate: 3.59 • Density: 0.06 • Severe Density: 0.25 • Total Crashes: 174 • Severe Crashes: 7 • Mileage: 110.7 mi • Rate: 0.86 • Severe Rate: 3.46 • Density: 0.31 • Severe Density: 1.26 LEGEND Severe Crashes = Fatal + A Severity Rate=Total crashes per Million Vehicle Miles (MVM) Severe Rate = Severe crashes per 100 MVM Density = Total crashes per miles per year Severe Density = Severe crashes per 100 miles per year State County City Other • Total Crashes: 71 • Severe Crashes: 4 • Mileage: 406.4 • Rate: 0.86 • Severe Rate: 4.85 • Density: 0.03 • Severe Density 0.20 • Total Crashes: 10 • Severe Crashes: 1 • Mileage: 405.9 mi • Rate: 0.53 • Severe Rate 5.34 • Density: 0.00 • Severe Density: 0.05 • Total Crashes: 45 • Severe Crashes: 0 • Mileage: 40.9 mi • Rate: 1.46 • Severe Rate: 0.00 • Density: 0.22 • Severe Density: 0.00 CSAH • Total Crashes: 53 • Severe Crashes: 4 • Mileage: 210.8 mi • Rate: 0.80 • Severe Rate: 6.05 • Density: 0.05 • Severe Density: 0.38 County Road • Total Crashes: 18 • Severe Crashes: 0 • Mileage: 195.6 mi • Rate: 1.10 • Severe Rate: 0.00 • Density: 0.02 • Severe Density 0.0 Source: Mn/DOT TIS, 2004-2008 Rate – MVM, Density – Crashes per Mile per Year Severe is fatal and serious injury crashes (K+A).
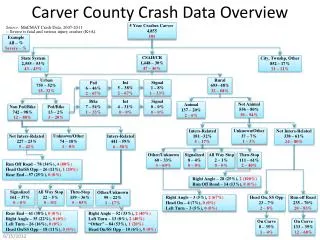
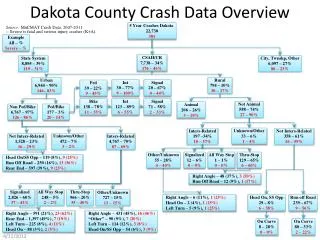
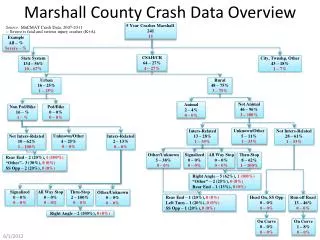
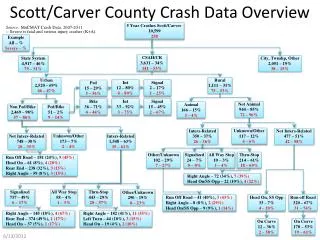
Big Stone - Crash Data Overview Source: MnCMAT Crash Data, 2005-2009 Severe is fatal and serious injury crashes (K+A). 5 Year Crashes Big Stone 729 32 Example All – % Severe – % State System 410 – 56% 18– 56% CSAH/CR 192 – 26% 11 – 34% City, Twnshp, Other 127 – 17% 3 – 9% Urban 74 – 39% 4 – 36% Rural 118 – 61% 7 – 64% Animal 30 – 25% 0 – 0% Not Animal 88 – 75% 7 – 100% Unknown/Other 9 – 12% 0 – 0% Not Inters-Related 31 – 42% 1 – 25% Inters-Related 34 – 46% 3 –75 % Unknown/Other 8 – 9% 0 – 0% Inters-Related 23 – 26% 3 – 43% Not Inters-Related 57 – 65% 4 – 57% Rear End/SSW Same – 6 (19%),0 (0%) Head On/SSW Opp – 6 (19%),0 (0%) Run Off Road – 5 (16%),0 (0%) Other/Unknown 22 – 96% 2 – 67% Signalized 0 – 0% 0 – 0% Thru-Stop 1 – 4% 1 – 33% All Way Stop 0 – 0% 0 – 0% Head On, SS Opp 3 – 5% 0 – 0% Run off Road 40 – 70% 2 – 50% Signalized 1 – 3% 0 – 0% All Way Stop 0 – 0% 0 – 0% Thru-Stop 20 – 59% 2 – 67% Other/Unknown 13 – 38% 1 – 33% Run Off Road – 6 (27%), 0 (0%) Head On/SSW Opp – 4 (18%),1 (50%) Right Angle– 4 (18%), 0 (0%) On Curve 0 – 0% 0 – 0% On Curve 11 – 28% 1 – 50% Right Angle – 11 (55%),1 (50%) Head On/SSW Opp – 3 (15%), 1 (50%) Rear End/SSW Same – 2 (10%),0 (0%) Left Turn– 3 (23%),0 (0%) Run Off Road– 3 (23%),0 (0%) Head On/SSW Opp – 2 (15%),0 (0%) Head On/SSW Opp– 1 (100%), 1 (100%)