Download
1 / 2
20 likes | 146 Vues
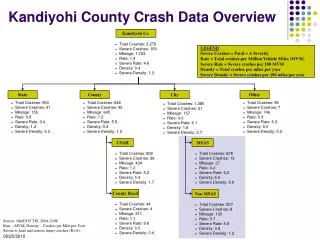
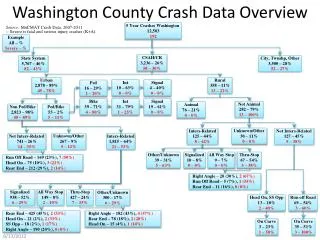
Washington County Crash Data Overview. 5 Year Crashes Washington 12,503 192. Example All – % Severe – %. CSAH/CR 3,236 – 26% 58 – 30%. State System 5,767 – 46 % 82 – 43%. City, Twnshp , Other 3,500 – 28% 52 – 27%. Source: MnCMAT Crash Data, 2007-2011

E N D
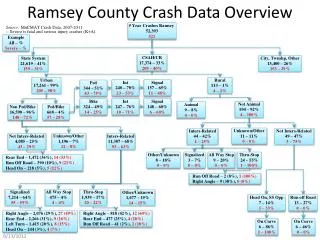
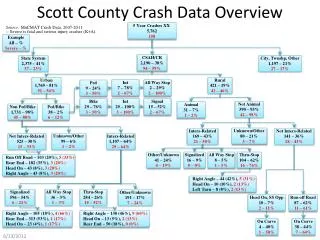
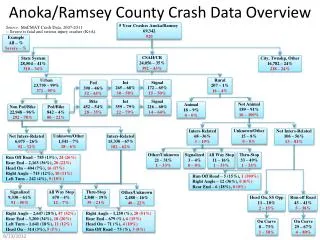
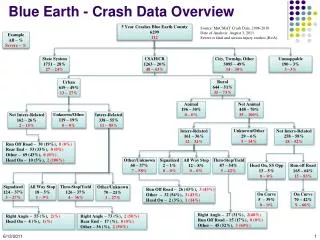
Washington County Crash Data Overview 5 Year Crashes Washington 12,503 192 Example All – % Severe – % CSAH/CR 3,236 – 26% 58 – 30% State System 5,767 – 46% 82 – 43% City, Twnshp, Other 3,500 – 28% 52 – 27% Source: MnCMAT Crash Data, 2007-2011 -- Severe is fatal and serious injury crashes (K+A). Urban 2,878 – 89% 45 – 78% Rural 358 – 11% 13 – 22% Int 10 – 63% 0 – 0% Signal 4 – 40% 0 – 0% Ped 16 – 29% 1 – 20% Bike 39 – 71% 4 – 80% Int 31 – 79% 1 – 25% Signal 19 – 61% 0 – 0% Not Animal 282 – 79% 13 – 100% Animal 76 – 21% 0 – 0% Non Ped/Bike 2,823 – 98% 40 – 89% Ped/Bike 55 – 2% 5 – 11% Unknown/Other 30 – 11% 0 – 0% Inters-Related 125 – 44% 8 – 62% Not Inters-Related 127 – 45% 5 – 38% Unknown/Other 267 – 9% 5 – 12% Not Inters-Related 741 – 26% 14 – 35% Inters-Related 1,815 – 64% 21 – 53% Other/Unknown 39 – 31% 5 – 63% Signalized 10 – 8% 0 – 0% All Way Stop 9 – 7% 0 – 0% Thru-Stop 67 – 54% 3 – 38% Run Off Road – 169 (23%), 7 (50%) • Head On – 75 (10%), 3 (21%) Rear End – 212 (29%), 2 (14%) Right Angle – 20 (30%), 2 (67%) Run Off Road – 5 (7%), 1 (33%) Rear End – 11 (16%), 0 (0%) Signalized 938 – 52% 6 – 29% All Way Stop 149 – 8% 2 – 10% Thru-Stop 427 – 24% 7 – 33% Other/Unknown 300 – 17% 6 – 29% Head On, SS Opp 13 – 10% 2 – 40% Run off Road 69 – 54% 3 – 60% Rear End – 425 (45%), 2 (33%) Head On – 21 (2%), 2 (33%) SS Opp– 18 (2%), 1 (17%) Right Angle – 190 (20%),0 (0%) Right Angle – 182 (43%), 4 (57%) Rear End – 78 (18%), 2 (28%) Head On – 15 (4%), 1 (14%) On Curve 3 – 23% 1 – 50% On Curve 35 – 51% 3 – 100%
Code Guide • Animal, ACCTYPE=08,09 • Rear End, DIAG=01 • Left Turn, DIAG=03 • Right Angle, DIAG=05 • Run off Road, DIAG=04, 07 (Road departure) • Head On, SS Opp, DIAG=08, 09 (Lane departure) • Curve-Related, ROAD CHAR=05-08 • State, SYS=01, 02, 03 • CSAH/CR, SYS=04, 07 • City, Twnshp, Other, SYS=NOT 01-03, 04 or 07 • Urban, City coded • Rural, City not coded (0000) • Intersection-Related, JUNC=2-7, 20-22 • Not Intersection-Related, JUNC=1, 8-11 • Other/Unknown, JUNC=90, 98, 99, 00 • Signalized, TCD=01 • All-Way Stop, TCD=02, 03 • Thru-Stop/Yield, TCD=04, 05 • Other/Unknown, TCD=>06 and 00