Overview of Severe Crashes in Greater Minnesota (2005-2009)
10 likes | 127 Vues
This report provides a comprehensive overview of severe and fatal crashes in Greater Minnesota from 2005 to 2009. During this period, there were a total of 160,410 crashes, with 5,300 classified as severe, including fatal and serious injury incidents. The data reveals crash distributions by location (rural, urban, city), type (animal-related, intersection-related), and various crash circumstances. Key statistics include the prevalence of run-off-road and right-angle collisions, highlighting significant safety concerns and areas for improvement in traffic safety measures.

Overview of Severe Crashes in Greater Minnesota (2005-2009)
E N D
Presentation Transcript
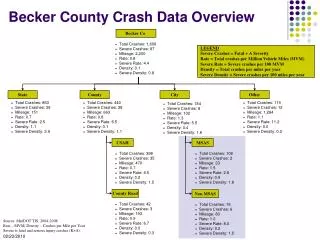
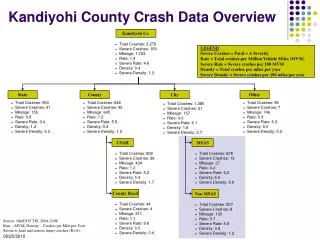
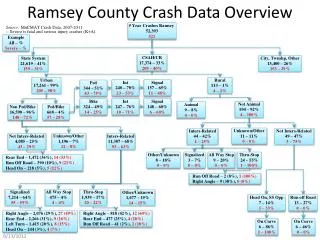
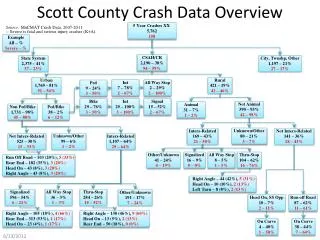
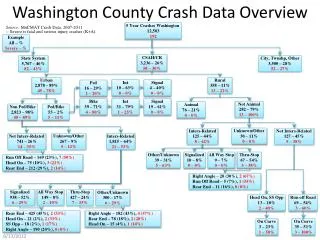
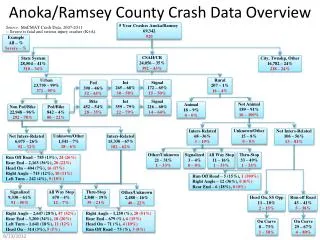
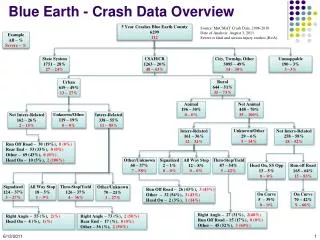
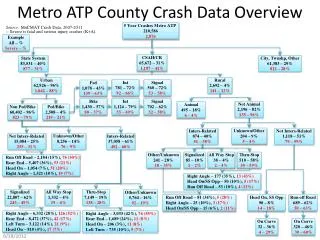
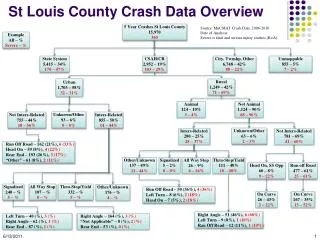
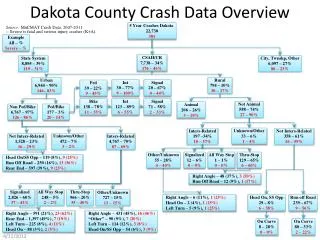
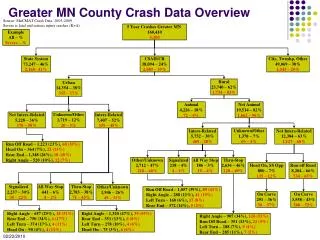
Greater MN County Crash Data Overview Source: MnCMAT Crash Data, 2005-2009 Severe is fatal and serious injury crashes (K+A). 5 Year Crashes Greater MN 160,410 5,300 Example All – % Severe – % State System 73,247 – 46% 2,168– 41% CSAH/CR 38,094 – 24% 2,089 – 39% City, Twnshp, Other 49,069 – 30% 1,043 – 20% Rural 23,740 – 62% 1,734 – 83% Urban 14,354 – 38% 355 – 17% Animal 4,226 – 18% 72 – 4% Not Animal 19,514 – 82% 1,662 – 96% Unknown/Other 1,719 – 12% 20 – 5% Not Inters-Related 5,228 – 36% 176 – 50% Inters-Related 7,407 – 52% 159 – 45% Unknown/Other 1,378 – 7% 66 – 4% Inters-Related 5,752 – 30% 469 – 28% Not Inters-Related 12,384 – 63% 1,127 – 68% Run Off Road – 1,223 (23%), 68 (39%) Head On – 364 (7%), 22 (13%) Rear End – 1,348 (26%),18 (10%) Right Angle – 520 (10%),12 (7%) Other/Unknown 2,712 – 47% 218 – 46% Signalized 218 – 4% 4 – 1% All Way Stop 186 – 3% 19 – 4% Thru-Stop 2,636 – 46% 228 – 49% Head On, SS Opp 800 – 7% 135 – 12% Run off Road 8,204 – 66% 734 – 65% Signalized 2,237 – 30% 35 – 22% All Way Stop 441 – 6% 4 – 2% Thru-Stop 2,783 – 38% 71 – 45% Other/Unknown 1,946 – 26% 49 – 31% Run Off Road – 1,057 (39%),89 (41%) Right Angle – 288 (11%),41 (19%) Left Turn – 168 (6%), 17 (8%) Rear End – 372 (14%),5(2%) On Curve 291 – 36% 50 – 37% On Curve 3,558 – 43% 380 – 52% Right Angle – 657 (29%), 18 (51%) Rear End – 750 (34%),6 (17%) Left Turn – 374 (17%), 4 (11%) Head On – 90 (4%), 4 (11%) Right Angle – 1,320 (47%),39 (55%) Rear End – 351 (13%),6 (8%) Left Turn – 278 (10%),4 (6%) Head On – 75 (3%), 4 (6%) Right Angle – 907 (34%),126 (55%) Run Off Road – 351 (13%),21(9%) Left Turn – 188 (7%),9 (4%) Rear End – 285 (11%), 7 (3%)