Metro ATP Crash Data Overview
40 likes | 216 Vues
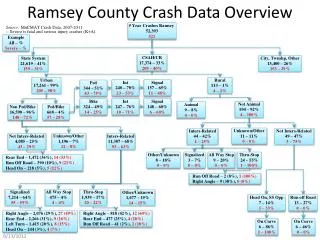
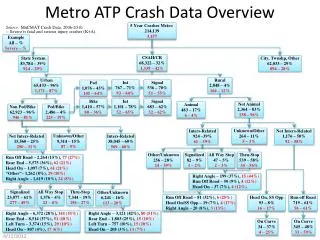
Metro ATP Crash Data Overview. 5 Year Crashes Metro 214,139 3,157. Example All – % Severe – %. CSAH/CR 68,322 – 32% 1,339 – 42%. State System 83,784 – 39% 924 – 29%. City, Twnshp , Other 62,033 – 29% 894 – 28%. Source: MnCMAT Crash Data, 2006-2010

Metro ATP Crash Data Overview
E N D
Presentation Transcript
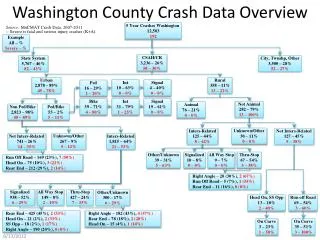
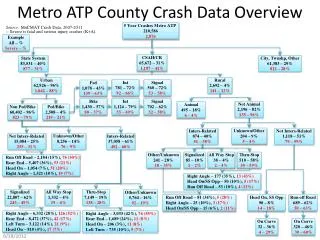
Metro ATP Crash Data Overview 5 Year Crashes Metro 214,139 3,157 Example All – % Severe – % CSAH/CR 68,322 – 32% 1,339 – 42% State System 83,784 – 39% 924 – 29% City, Twnshp, Other 62,033 – 29% 894 – 28% Source: MnCMAT Crash Data, 2006-2010 -- Severe is fatal and serious injury crashes (K+A). Urban 65,433 – 96% 1,171 – 87% Rural 2,848 – 4% 164 – 12% Int 767 – 71% 93 – 64% Signal 536 – 70% 51 – 55% Ped 1,076 – 43% 145 – 64% Bike 1,410 – 57% 80 – 36% Int 1,101 – 78% 52 – 65% Signal 683 – 62% 32 – 62% Not Animal 2,364 – 83% 158 – 96% Animal 483 – 17% 6 – 4% Non Ped/Bike 62,923 – 96% 946 – 81% Ped/Bike 2,486 – 4% 225 – 19% Unknown/Other 264 – 11% 5 – 3% Inters-Related 924 –39% 61 – 39% Not Inters-Related 1,176 – 50% 92 – 58% Unknown/Other 9,314 – 15% 87 – 9% Not Inters-Related 15,560 – 25% 290 – 31% Inters-Related 38,045 – 60% 569 – 60% Other/Unknown 256 – 28% 24 – 39% Signalized 82 – 9% 1 – 2% All Way Stop 47 – 5% 2 – 3% Thru-Stop 539 – 58% 34 – 56% Run Off Road – 2,264 (15%), 77 (27%) Rear End – 5,575 (36%), 62 (21%) Head On – 1,097 (7%), 61 (21%) “Other”– 1,262 (8%), 29 (10%) Right Angle – 1,619 (10%), 24 (8%) Right Angle – 199 (37%), 15 (44%) Run Off Road – 50 (9%), 4 (12%) Head On – 37 (7%), 4 (12%) Signalized 23,077 – 61% 277 – 49% All Way Stop 1,376 – 4% 23 – 4% Thru-Stop 7,344 – 19% 156 – 27% Other/Unknown 6,241 – 16% 113 – 20% Run Off Road – 81 (32%), 6 (25%) Head On/SS Opp – 19 (7%), 4 (17%) Right Angle – 20 (8%), 3 (13%) Head On, SS Opp 93 – 8% 16 – 17% Run off Road 719 – 61% 56 – 61% Right Angle – 6,372 (28%), 141 (51%) Rear End – 8,514 (37%), 51 (18%) Left Turn – 3,374 (15%), 29 (10%) Head On – 807 (4%), 17 (6%) Right Angle – 3,121 (42%), 80 (51%) Rear End – 1,803 (25%), 15 (10%) Left Turn – 757 (10%), 15 (10%) Head On – 208 (3%), 11 (7%) On Curve 34 – 37% 4 – 25% On Curve 345 – 48% 33 – 59%
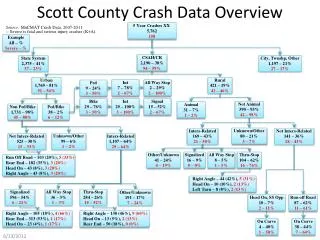
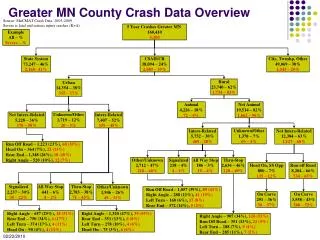
Metro/Out-State Crash Data Overview 5 Year Crashes State 382,452 8,285 Example All – % Severe – % CSAH/CR 108,173 – % 3,393 – % State System 156,620 – % 2,962 – % City, Twnshp, Other 116,408 – % 1,913 – % Source: MnCMAT Crash Data, 2006-2010 -- Severe is fatal and serious injury crashes (K+A). Metro Urban 65,433 – 96% 1,171 – 87% Out State Rural 22,630 – 62% 1,626 – 83% Int 767 – 71% 93 – 64% Signal 536 – 70% 51 – 55% Ped 1,076 – 43% 145 – 64% Bike 1,410 – 57% 80 – 36% Int 1,101 – 78% 52 – 65% Signal 683 – 62% 32 – 62% Not Animal 18,616 – 82% 1,566 – 96% Animal 4,009 – 18% 60 – 4% Non Ped/Bike 62,923 – 96% 946 – 81% Ped/Bike 2,486 – 4% 225 – 19% Unknown/Other 1,276 – 7% 61 – 4% Inters-Related 5,487 – 29% 463 – 30% Not Inters-Related 11,849 – 64% 1,042 –66% Unknown/Other 9,314 – 15% 87 – 9% Not Inters-Related 15,560 – 25% 290 – 31% Inters-Related 38,045 – 60% 569 – 60% Run Off Road – 2,264 (15%), 77 (27%) Rear End – 5,575 (36%), 62 (21%) Head On – 1,097 (7%), 61 (21%) “Other”– 1,262 (8%), 29 (10%) Right Angle – 1,619 (10%), 24 (8%) Other/Unknown 2,600 – 47% 228 – 49% Signalized 209 – 4% 4 – 1% All Way Stop 164 – 3% 15 – 3% Thru-Stop 2,511 – 46% 216 – 47% Head On, SS Opp. 751 – 6% 132 – 13% Run off Road 7,891 – 67% 675 – 65% Run Off Road – 999 (38%), 95 (42%) Right Angle – 268 (10%), 39 (17%) “Other” – 303 (12%), 29 (13%) Head On – 112 (4%), 21 (9%) Signalized 23,077 – 61% 277 – 49% All Way Stop 1,376 – 4% 23 – 4% Thru-Stop 7,344 – 19% 156 – 27% Other/Unknown 6,241 – 16% 113 – 20% On Curve 247 – 33% 46 – 35% On Curve 3,222 – 40% 339 – 50% Right Angle – 6,372 (28%), 141 (51%) Rear End – 8,514 (37%), 51 (18%) Left Turn – 3,374 (15%), 29 (10%) Head On – 807 (4%), 17 (6%) Right Angle – 3,121 (42%), 80 (51%) Rear End – 1,803 (25%), 15 (10%) Left Turn – 757 (10%), 15 (10%) Head On – 208 (3%), 11 (7%) Right Angle – 849 (34%), 122 (56%) “Other” – 464 (18%), 33 (15%) Run Off Road – 342 (14%), 21 (10%) Left Turn – 184 (7%), 10 (5%) 5/21/2012
Code Guide • Animal, ACCTYPE=08,09 • Rear End, DIAG=01 • Left Turn, DIAG=03 • Right Angle, DIAG=05 • Run off Road, DIAG=04, 07 (Road departure) • Head On, SS Opp, DIAG=08, 09 (Lane departure) • Curve-Related, ROAD CHAR=05-08 • State, SYS=01, 02, 03 • CSAH/CR, SYS=04, 07 • City, Twnshp, Other, SYS=NOT 01-03, 04 or 07 • Urban, City coded • Rural, City not coded (0000) • Intersection-Related, JUNC=2-7, 20-22 • Not Intersection-Related, JUNC=1, 8-11 • Other/Unknown, JUNC=90, 98, 99, 00 • Signalized, TCD=01 • All-Way Stop, TCD=02, 03 • Thru-Stop/Yield, TCD=04, 05 • Other/Unknown, TCD=>06 and 00