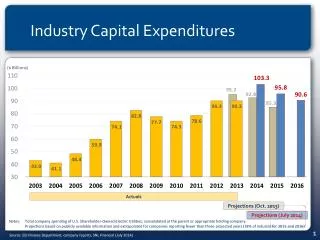
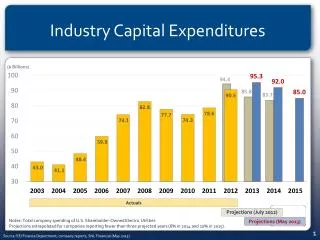
Industry Capital Expenditures
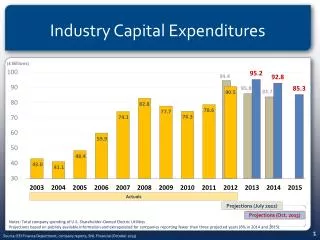
This report outlines the capital expenditures of U.S. shareholder-owned electric utilities, highlighting both actual spending and future projections. Key insights include total spending estimates for 2014 and 2015, with a projection of 6% for 2014 and 10% for 2015, while taking into account data from companies reporting fewer than three projected years. The analysis is based on information from the EEI Finance Department, company reports, and SNL Financial, providing a comprehensive overview of capital expenditure trends from 2010 to 2012.

Industry Capital Expenditures
E N D
Presentation Transcript
Industry Capital Expenditures Actuals Projections (July 2012) Notes: Total company spending of U.S. Shareholder-Owned Electric Utilities Projections extrapolated for companiesreporting fewer than three projected years (6% in 2014 and 10% in 2015). Projections (May 2013) 1 Source: EEI Finance Department, company reports, SNL Financial (May 2013)
Projected Functional CapEx 2010P 2012P as of August 2010 as of August 2012 $94.4 B 14% $82.8 B Generation Distribution Transmission Gas-Related Environment Other Source: EEI Finance Department, company reports (August 2012)