Aggregate Expenditures
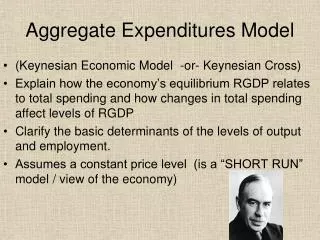
Aggregate Expenditures. Keynesianism. Keynes and the Depression. Say’s Law says that producing goods generates an amount of income equal to the value of the goods produced Great Depression Keynes theorizes that not all income is spent leaving surpluses


Aggregate Expenditures
E N D
Presentation Transcript
Aggregate Expenditures Keynesianism
Keynes and the Depression • Say’s Law says that producing goods generates an amount of income equal to the value of the goods produced • Great Depression • Keynes theorizes that not all income is spent leaving surpluses • In other words, the economy is not self-adjusting and that external forces not always the cause of recession, there are also internal forces caused by failure of certain fundamental economic decisions (savings and investing)
Disposable Income (DI)Consumption • Income after taxes or net income • DI=Gross Income – Taxes • 2 Choices with disposable income • Consume or Save • Average Propensity to Consume • APC = consumption/income • Average Propensity to Save • APS = saving/income • APC + APS = 1
Marginal Propensity to Consume (MPC) • The fraction of any change in disposable income that is consumed. • MPC= Change in Consumption Change in Disposable Income • MPC = ΔC/ΔDI
Marginal Propensity to Save (MPS) • The fraction of any change in disposable income that is saved. • MPS= Change in Savings Change in Disposable Income • MPS = ΔS/ΔDI
Marginal Propensities • MPC + MPS = 1 • .: MPC = 1 – MPS • .: MPS = 1 – MPC • Remember, people do two things with their disposable income, consume it or save it!
The Spending Multiplier Effect • An initial change in spending (C, IG, G, XN) causes a larger change in aggregate spending, or Aggregate Demand (AD). • Multiplier = Change in AD Change in Spending • Multiplier = Δ AD/Δ C, I, G, or X
The Spending Multiplier Effect • Why does this happen? • Expenditures and income flow continuously which sets off a spending increase in the economy.
Calculating the Spending Multiplier • The Spending Multiplier can be calculated from the MPC or the MPS. • Multiplier = 1/1-MPC or 1/MPS • Multipliers are (+) when there is an increase in spending and (–) when there is a decrease
MPS, MPC, & Multipliers • Ex. Assume U.S. citizens spend 90¢ for every extra $1 they earn. Further assume that the real interest rate (r%) decreases, causing a $50 billion increase in gross private investment. Calculate the effect of a $50 billion increase in IG on U.S. Aggregate Demand (AD). • Step 1: Calculate the MPC and MPS • MPC = ΔC/ΔDI = .9/1 = .9 • MPS = 1 – MPC = .10 • Step 2: Determine which multiplier to use, and whether it’s + or - • The problem mentions an increase in Δ IG .: use a (+) spending multiplier • Step 3: Calculate the Spending and/or Tax Multiplier • 1/MPS = 1/.10 = 10 • Step 4: Calculate the Change in AD • (Δ C, IG, G, or XN) * Spending Multiplier • ($50 billion Δ IG) * (10) = $500 billion ΔAD
Calculating the Tax Multiplier • When the government taxes, the multiplier works in reverse • Why? • Because now money is leaving the circular flow • Tax Multiplier (note: it’s negative) • = -MPC/1-MPC or -MPC/MPS • If there is a tax-CUT, then the multiplier is +, because there is now more money in the circular flow
MPS, MPC, & Multipliers • Ex. Assume U.S. citizens spend 90¢ for every extra $1 they earn. Further assume that the real interest rate (r%) decreases, causing a $50 billion increase in gross private investment. Calculate the effect of a $50 billion increase in IG on U.S. Aggregate Demand (AD). • Step 1: Calculate the MPC and MPS • MPC = ΔC/ΔDI = .9/1 = .9 • MPS = 1 – MPC = .10 • Step 2: Determine which multiplier to use, and whether it’s + or - • The problem mentions an increase in Δ IG .: use a (+) spending multiplier • Step 3: Calculate the Spending and/or Tax Multiplier • 1/MPS = 1/.10 = 10 • Step 4: Calculate the Change in AD • (Δ C, IG, G, or XN) * Spending Multiplier • ($50 billion Δ IG) * (10) = $500 billion ΔAD
MPS, MPC, & Multipliers • Ex. Assume Germany raises taxes on its citizens by €200 billion . Furthermore, assume that Germans save 25% of the change in their disposable income. Calculate the effect the €200 billion change in taxes on the German economy. • Step 1: Calculate the MPC and MPS • MPS = 25%(given in the problem) = .25 • MPC = 1 – MPS = 1 - .25 = .75 • Step 2: Determine which multiplier to use, and whether it’s + or - • The problem mentions an increase in T.: use (-) tax multiplier • Step 3: Calculate the Spending and/or Tax Multiplier • -MPC/MPS = -.75/.25 = -3 • Step 4: Calculate the Change in AD • (Δ Tax) * Tax Multiplier • (€200 billion Δ T) * (-3) = -€600 billion Δ in AD
MPS, MPC, & Multipliers • Ex. Assume the Japanese spend 4/5 of their disposable income. Furthermore, assume that the Japanese government increases its spending by ¥50 trillion and in order to maintain a balanced budget simultaneously increases taxes by ¥50 trillion. Calculate the effect the ¥50 trillion change in government spending and ¥50 trillion change in taxes on Japanese Aggregate Demand. • Step 1: Calculate the MPC and MPS • MPC = 4/5 (given in the problem) = .80 • MPS = 1 – MPC = 1 - .80 = .20 • Step 2: Determine which multiplier to use, and whether it’s + or - • The problem mentions an increase in G and an increase in T.: combine a (+) spending with a (–) tax multiplier • Step 3: Calculate the Spending and Tax Multipliers • Spending Multiplier = 1/MPS = 1/.20 = 5 • Tax Multiplier = -MPC/MPS = -.80/.20 = -4 • Step 4: Calculate the Change in AD • [ Δ G * Spending Multiplier] + [ Δ T * Tax Multiplier] • [(¥50 trillion Δ G) * 5] + [(¥50 trillion Δ T) * -4] • [ ¥250 trillion ] + [ - ¥200 trillion ] = ¥50 trillion Δ AD
What is Investment? • Money spent or expenditures on: • New plants (factories) • Capital equipment (machinery) • Technology (hardware & software) • New Homes • Inventories (goods sold by producers)
Expected Rates of Return • How does business make investment decisions? • Cost / Benefit Analysis • How does business determine the benefits? • Expected rate of return • How does business count the cost? • Interest costs • How does business determine the amount of investment they undertake? • Compare expected rate of return to interest cost • If expected return > interest cost, then invest • If expected return < interest cost, then do not invest
Real (r%) v. Nominal (i%) • What’s the difference? • Nominal is the observable rate of interest. Real subtracts out inflation (π%)and is only known ex post facto. • How do you compute the real interest rate (r%)? r% = i% - π% • What then, determines the cost of an investment decision? • The real interest rate (r%)
Investment Demand Curve (ID) • What is the shape of the Investment demand curve? • Downward sloping • Why? • When interest rates are high, fewer investments are profitable; when interest rates are low, more investments are profitable • Conversely, there are few investments that yield high rates of return, and many that yield low rates of return
The Investment Demand Curve Changes in r% cause changes in IG. Factors other than r% may shift the entire ID curve r% 5% 3% ID IG $2 trillion $3 trillion
Shifts in Investment Demand (ID) • Cost of Production • Lower costs shift ID • Higher costs shift ID • Business Taxes • Lower business taxes shift ID • Higher business taxes shift ID • Technological Change • New technology shifts ID • Lack of technological change shifts ID • Stock of Capital • If an economy is low on capital, then ID • If an economy has much capital, then ID • Expectations • Positive expectations shift ID • Negative expectations shift ID
Shifts in Investment Demand When investment demand shifts, different levels of gross private investment occur even while r% remains constant r% 4% ID1 ID IG $2.5 trillion $3.25 trillion
Instability of Investment • Durability • Capital has a long life-span, therefore once it is built there is no immediate need for further investment • Irregularity of Innovation • Innovation does not proceed in a smooth linear fashion, instead there are bursts of innovation followed by periods of relative stability • Variability of Profits • Profitability is subject to the forces of competition, cyclical changes in the economy, and human management decisions • Variability of Expectations • Political, social and natural phenomenon shape our positive and negative expectations of the future
Instability of Investment • Many economists believe that investment instability is the chief cause of the business cycle.
Loanable Funds Market • The market where savers and borrowers exchange funds (QLF) at the real rate of interest (r%). • The demand for loanable funds, or borrowing comes from households, firms, government and the foreign sector. The demand for loanable funds is in fact the supply of bonds. • The supply of loanable funds, or savings comes from households, firms, government and the foreign sector. The supply of loanable funds is also the demand for bonds.
Loanable Funds Market in Equilibrium r% SLF & DBonds r DLF & SBonds QLF q
Changes in the Demand for Loanable Funds • Remember that demand for loanable funds = borrowing (i.e. supplying bonds) • More borrowing = more demand for loanable funds () • Less borrowing = less demand for loanable funds () • Examples • Government deficit spending = more borrowing = more demand for loanable funds .: DLF .: r%↑ • Less investment demand = less borrowing = less demand for loanable funds .: DLF.: r%↓
Increase in the Demand for Loanable Funds r% SLF r1 r DLF 1 DLF QLF q q1 DLF .: r% ↑ & QLF↑
Decrease in the Demand for Loanable Funds r% SLF r r1 DLF DLF 1 QLF q1 q DLF .: r% ↓ & QLF ↓
Changes in the Supply of Loanable Funds • Remember that supply of loanable funds = saving (i.e. demand for bonds) • More saving = more supply of loanable funds() • Less saving = less supply of loanable funds () • Examples • Government budget surplus = more saving = more supply of loanable funds .: SLF .: r%↓ • Decrease in consumers’ MPS = less saving = less supply of loanable funds .: SLF.: r%↑
Increase in the Supply of Loanable Funds r% SLF SLF 1 r r1 DLF QLF q q1 SLF .: r% ↓ & QLF↑
Decrease in the Supply of Loanable Funds SLF 1 r% SLF r1 r DLF QLF q q1 SLF .: r% ↑ & QLF ↓
Final thoughts on Loanable Funds • Loanable funds market determines the real interest rate (r%). • Loanable funds market relates saving and borrowing. • Changes in saving and borrowing create changes in loanable funds and therefore the r% changes. • When government does fiscal policy it will affect the loanable funds market. • Changes in the real interest rate (r%) will affect Gross Private Investment
Effect of Expansionary Fiscal Policy on Loanable Funds & Investment SLF r% r% r1 r DLF 1 ID DLF IG q q1 QLF I I1 G↑ and/or T↓ .: Government deficit spends .: DLF .: r%↑ .: IG↓ (Crowding-Out Effect)