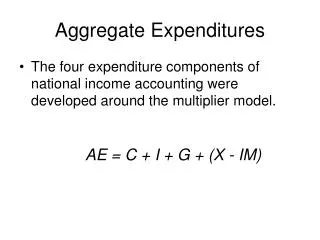
Building the Aggregate Expenditures Model
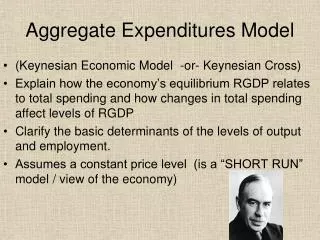
Building the Aggregate Expenditures Model. Keynesian Economics. John Maynard Keynes. British Economist (1883-1946) Theorized that “Classical Economics” was plagued by a periodic recession and required government assistance to help jump start the economy

Building the Aggregate Expenditures Model
E N D
Presentation Transcript
Building the Aggregate Expenditures Model Keynesian Economics
John Maynard Keynes • British Economist (1883-1946) • Theorized that “Classical Economics” was plagued by a periodic recession and required government assistance to help jump start the economy • Recent resurgence due to the instability and corruption of 2008
General Theory of Employment Bretton Woods conference prior to WWII gave birth to the creation of the World Bank and the I.M.F. which still exist today John Maynard Keynes
Equilibrium GDP • Firms look to produce an amount equal to that of what they believe will be purchased • Aggregate Expenditures schedule depicts these outputs at various levels • Remember, for this chapter consumption is directly related to the income level where investment is not. Investment is planned regardless of income situation
Disequilibrium • The economy will work to achieve equilibrium from either the consumer end or the producer end, but according to Keynes, requires the government to intervene and stimulate aggregate demand.
Other Features • GDP = Investment + Consumption • Savings represents a leakage from the spending stream and causes C to be less than GDP • Investment is referred to as an injection
Simplifications • For this chapter we need to assume the following: • Aggregate spending only consists of consumption and investment • GDP = NI = PI = DI • There is no account of government spending or foreign trade in this chapter for purposes of simplicity
Consumption & Savings • Consumption is the largest component of aggregate expenditures • DI = Consumption + Savings • What is not spent is considered savings • Disposable income has a direct relationship with both consumption & savings
Consumption & Savings • Break-even Income – Point at which household consumption = income • APC – Avg. Propensity to Consume • APS – Avg. Propensity to Save • APC = Consumption / Income • APS = Savings / Income
Marginal Propensities • MPS – Marginal Propensity to Save • MPC – Marginal Propensity to Consume • Is measured to see how income will change the amounts that are saved and spent • MPC + MPS always = 1 , APC + APS =1
Non-Income Determinants • Wealth • Expectations of Future Economic Activity • Taxation • Household Debt
Investment • Second component of private spending • Investment decision weighs marginal benefit vs. marginal cost • Rate of return = Benefit • Interest Rate = Cost • Rate of Return = Revenue – Cost • If Real Interest Rate exceeds Rate of Return, investment should not be made
Investment Data • Measured with Investment Demand Schedule • Shows inverse relationship between Return and Interest • Understand reduction of interest rates directly effects investment
Investment Data • Shifts in the curve are caused by other factors. These include: • Capital Goods acquired, maintained, & operated • Business Taxes • Technology • Stock of Capital Goods • Future Expectations
Investment Schedules • Economists define by determining exactly how much individual businesses will invest at every level of GDP or DI. • Assume investment is independent from income
Investment Volatility • Capital Goods are durable meaning investment can be postponed • Innovation occurs irregularly • Profits vary considerably • Expectations Change Easily
Equilibrium GDP • We measure producer output and income by depicting these graphically • Producers seek to reach equilibrium • It is assumed that income level = output • Investment is independent of income and planned regardless • C + Ig = GDP (Output)
Equilibrium GDP • Savings and planned investment are equal • Saving represent a “leakage” in consumption causing it to be less than GDP • The economy is in never ending state to reach this equilibrium. The goal is to have Income = Output. Until that happens, inventories will always fluctuate based on circumstance.