1 / 44

2.4 Graphs of Functions

2.4 Graphs of Functions. The graph of a function is the graph of its ordered pairs. Graphing a Function by Plotting Points. Steps for Graphing an Equation Using a Graphing Utility. Steps for Graphing an Equation Using a Graphing Utility. Steps for Graphing an Equation Using a Graphing Utility.

Télécharger la présentation

2.4 Graphs of Functions

An Image/Link below is provided (as is) to download presentation Download Policy: Content on the Website is provided to you AS IS for your information and personal use and may not be sold / licensed / shared on other websites without getting consent from its author. Content is provided to you AS IS for your information and personal use only. Download presentation by click this link. While downloading, if for some reason you are not able to download a presentation, the publisher may have deleted the file from their server. During download, if you can't get a presentation, the file might be deleted by the publisher.

E N D

Presentation Transcript


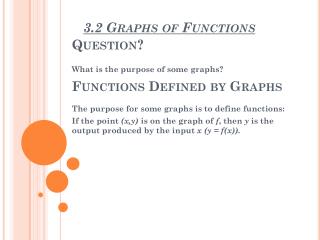
  1. 2.4 Graphs of Functions The graph of a function is the graph of its ordered pairs.

  2. Graphing a Function by Plotting Points

  3. Steps for Graphing an Equation Using a Graphing Utility

  4. Steps for Graphing an Equation Using a Graphing Utility

  5. Steps for Graphing an Equation Using a Graphing Utility

  6. Ex 1: Graphing a Function by Plotting Points

  7. Solution

  8. Solution Contd.

  9. Solution Contd.

  10. Solution Contd.

  11. Solution Contd.

  12. Practice Exercise

  13. Answer

  14. Obtaining Information From Graphs You can obtain information about a function from its graph. At the right or left of a graph, you will find closed dots, open dots, or arrows. • An arrow indicates that the graph extends indefinitely in the direction in which the arrow points.

  15. Obtaining Information From Graphs • A closed dot indicates that the graph does not extend beyond this point and the point belongs to the graph. • An open dot indicates that the graph does not extend beyond this point and the point does not belong to the graph.

  16. Ex 2: Obtaining Information From a Function’s Graph

  17. Solution of part a.

  18. Solution of part b.

  19. Solution of part c.

  20. The Vertical Line Test If any vertical line intersects a graph in more than one point, the graph does not define y as a function of x.

  21. Ex 3: Using the Vertical Line Test

  22. Solution

  23. Increasing Function A function is increasing on an interval if for any x1 and x2 in the interval, where x1<x2, then f(x1)<f(x2).

  24. Decreasing Function A function is Decreasing on an interval if for any x1 and x2 in the interval, where x1<x2, then f(x1)>f(x2).

  25. Constant Function A function is constant on an interval if for any x1 and x2 in the interval, where x1<x2, then f(x1)=f(x2).

  26. Ex 4: Intervals on Which a Function Increases, Decreases, or Is Constant

  27. Solution

  28. Even Function

  29. Odd Function

  30. Identifying Even or Odd Functions

  31. Solution

  32. Solution for part a.

  33. Solution for part b.

  34. Solution for part c.

  35. Even Functions and y-Axis Symmetry

  36. Odd Functions and Origin Symmetry

  37. Graphs of Common Functions Use a graphing utility to verify the following six graphs.

  38. Constant Function • Domain: • Range: the single number • Constant on • Even function

  39. Identity Function

  40. Standard Quadratic Function

  41. Standard Cubic Function

  42. Square Root Function

  43. Absolute Value Function

  44. Greatest Integer Function

More Related