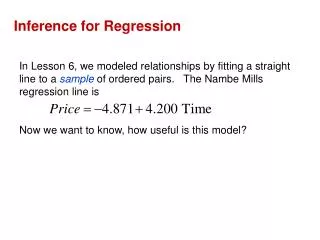
Inference for Regression
Inference for Regression. Chapter 27. Linear Regression. A model that describes the relationship between two variables. Line of best fit Use the TI to determine ________ Correlation , r Describes the strength of our line of best fit r<0 indicates… r>0 indicates… r = 0 indicates…

Inference for Regression
E N D
Presentation Transcript
Inference for Regression Chapter 27
Linear Regression • A model that describes the relationship between two variables. • Line of best fit • Use the TI to determine • ________ • Correlation, r • Describes the strength of our line of best fit • r<0 indicates… • r>0 indicates… • r = 0 indicates… • Used to make predictions,
Seeing the Data • Scatter plots • Line of Best Fit
What is inference for regression? • In the sample data there may be a correlation that can be represented by a line of best fit. • Inference for regression • Does our data suggest that there is a correlation …
Conditions/Assumptions • Straight Enough • Independence • Does the Plot Thicken? • Normal
Straight Enough Condition • Does the plot look _____? • Be careful about drawing a line…
Independence • Randomization? • Is the sample Representative? • Does the plot of the _____ against x show a clumping or pattern? • ___________ • Clumping can indicate …
Time • If the data are measured over time, plot the residuals against time to check for evidence of patterns that might suggest they are not independent.
Does the Plot Thicken? • Is the variability of y fairly consistent for all values of x? • Check Scatter Plot • Make sure …
Scatter Plot Predicaments • ________ • ________ • ______ • _______
Normal • Is the histogram of the residuals nearly normal? • _______ • _______ • We assume the errors around the idealized (population) regression line
The Test • Lets remember what we are testing: • Does our data suggest that there is a correlation in the ________?
Regression Slope T-Test • Hypotheses: • Ho : • H1 : • there is a linear relationship between ______ and ______. • _______ increases with _______ • _______decreases with _______ • State the Model and Test: • ________ • We will use a regression slope t-test. • Run the test • ________ • Draw the Conclusion
Confidence interval • For slope • The formula for a confidence interval for 1 is • But don’t worry too much about it, our calculator can do it for us • _________
Example • Does a person’s cholesterol level tend to increase with age? Data collected in Framingham, MA, from 294 adults aged 45-62 produced the regression analysis shown. Assuming that the data satisfy the condition for inference, examine the association between age and cholesterol level. Dependent variable is: Cholesterol Variable Coefficient SE(Coeff) t-ratio P-value Intercept 196.619 33.21 5.92< 0.0001 Age .0745779 0.6075 1.23 0.2206 *for a two tailed test* • State an appropriate hypothesis for the slope. • Test your hypothesis and state your conclusion. The Test: • Ho : • H1 : Assumptions: State the Model: Conclusion:
Example #2 • In March 2002, Consumer Reports reviewed several models of inkjet printers. Shown are the speed of the printer (in pages per minute) and the cost per page printed. Is there evidence of an association between speed and cost? Test an appropriate hypothesis and state your conclusion.