Download
1 / 26
260 likes | 404 Vues
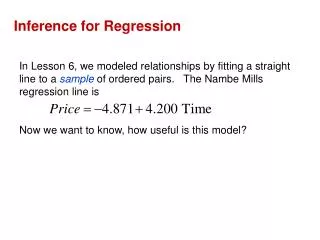
This guide will walk you through performing a linear regression T-test and calculating a confidence interval for the regression slope. We’ll use sample data from a restaurant to predict the amount of tip based on the customer’s bill. The process involves visualizing data with a scatter plot, determining the least squares regression line (LSRL), testing for evidence of a linear relationship using a significance level of 5%, and interpreting the statistical results. We will also calculate confidence intervals to provide insight into the true population slope estimation.

E N D
Learning Objective: • -Perform a Linear Regression T-test and calculate and interpret a confidence interval for regression slope.
a= y-intercept of our sample data • b=slope of our sample data. Estimating Parameters (we need to denote our population data differently than our sample data) Let: α= true population y-intercept ß= true population slope
Step 1: Create a scatter plot so you can visually see what this data looks like. Think about what is the explanatory and the response variable?
Suppose a local restaurant wanted to predict the amount of tip left based on the amount of the customer’s bill. • Find the LSRL in your calculator: -0.7367+0.164x x=amount of bill y=amount of tip (Don’t forget to define your variables!)
Whenever we have a linear regression test on the AP exam, they will give you computer output of the numbers all crunched for you! The first step with a Linear Regression t-test and interval is to learn how to read the computer output!! So this is what you would get!
Let’s start off with the simple part: Notice it’s the same equation we got when typing it in our calculator earlier.
After you get your LSRL, we don’t need any more data from the top row so cross it out! (leave you’re y-intercept: -0.7367)
Our question of interest: Using a 5%significance level, is there evidence of a linear relationship between the amount of a bill and the amount that was tipped? (Assume the conditions for inference are met) • Remember: If they ask you “is there evidence”, you have to complete a test. • We will use a linear regression t-test, since we are determining if there is a relationship between 2 quantitative variables. (** Chi-squared independence test was when we have categorical data)
PHATACDS template for Linear Regression t-test • In order to show a linear relationship, we can test to see if the slope is positive or negative (no slope=no association) • Since the sample data gives us a slope using “b”, we can denote the population slope using “ß”. • ß= true slope of y per x (in context of the problem) • Ho: ß=0 (this really means no association) • Ha: ß≠0 (this really means there is an association)
Assumptions: If you have a linear regression output on the AP exam-it will always state- Assume your assumptions are met. (So don’t worry about them!) • Test Name: Linear Regression T-test • Alpha: 0.05
Calcualtions: P(t> ___)=p-value Degrees of Freedom: (there are 2 variables so we use n-2, not n-1) • Decision and Statement: Since p<α, …….SAME THING WE’VE BEEN DOING!!
ß= true slope of amount tipped per the amount of the bill • ß=0 • ß≠0 • Assumptions: stated in problem they are met. • Linear Regression T-test • α = 0.05 • Calculations (given in the table): 2P(t> 9.18)=0.0027 Degrees of Freedom: = 3 • Decision and Statement: Since p<α, it is statistically significant, therefore we reject . There’s enough evidence to suggest there’s a relationship between the amount of a bill and the amount tipped.
Example: The following data was taken from 50 students in an AP Environmental class.
What is the slope? Interpret? On average, for every point increase on a student’s quiz grade, the final grade will increase by 0.75 points. • What % of the variation in the final grade can be explained through the variation of the least-squares regression line of final grade on quiz grade? r²=37% • What is the correlation? Interpret? r=0.61 (It is positive b/c the slope is positive) There is a moderate positive linear relationship between quiz grades and a final grade.
Is there evidence of an association between a student’s quiz grade and their final grade. • ß= true slope of final grade per quiz grade • ß=0 • ß≠0 • Assumptions: stated in problem they are met. • Linear Regression T-test • α = 0.05 • Calculations (given in the table): 2P(t> 5.31)=0.000 Degrees of Freedom: 50-2= 48 • Decision and Statement: Since p<α, it is statistically significant, therefore we reject . There’s enough evidence to suggest there’s a relationship between the quiz grade and a students final grade.
Confidence Intervals: • A level C confidence interval for the slope of the true regression line is: where =standard error of the slope We find in the table in the back of your book (use the degrees of freedom and CI % to find it).
Ex: Compute a 95% confidence interval for the true slope of amount tipped per cost of bill.
Name: Linear Regression t-interval • Assumptions: Stated in the problem they are met • Calculations: First look up the value: Go to 95%, df=3 df=3 • Statement: We are 95% confident that the true slope of amount tipped per cost of bill is between 0.107 and 0.221.
How well do golfers’ scores in the first round of a two-round tournament predict their scores in the second round? The data for 12 members of a college’s women’s golf team in a recent tournament are listed below. Is there good evidence that there is an association between first and second round scores? (Assume conditions for inference are met) Example:
ß= true slope of score on round B per score of round A • ß=0 • ß≠0 • Assumptions: stated in problem they are met. • Linear Regression T-test • α = 0.05 • Calculations (given in the table): 2P(t> 2.99)=0.0136 Degrees of Freedom: 12-2= 10 • Decision and Statement: Since p<α, it is statistically significant, therefore we reject . There’s enough evidence to suggest there’s a relationship between the score on round A and round B.
Give a 95% confidence interval for the increased rate of golf scores. Linear Regression t-interval Assumptions: Stated in the problem they are met Calculations: df=10 • Statement: We are 95% confident that the true slope of score of round B per Round A is b/w 0.1753 and 1.200.
What is the line of best fit? Define any variables. x=score of Round A y=score of Round B • Interpret the slope: b=0.6877 On average for every increase in score of Round A, we expect Round B to increase by 0.6877 points • Interpret the y-intercept: a= 26.332 When the score on round A is 0, we predict the score of round B to be 26.332
Linear Regression t-interval Assump: Stated in the problem they are met df=10-2=8 We are 95% confident that the true slope of score of fuel consumption per # of railcars is b/w 1.889 and 2.409.