Download
1 / 1
10 likes | 123 Vues
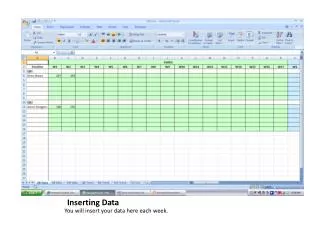
6.5. 45. 44. 6. 43. 42. 5.5. 41. Mean Wetness. Mean Greenness. 40. 5. 39. 38. 4.5. 37. 4. 36. High. Low. Low. High. Application: Individual health promotion. Data: Cohort Patient Addresses. Residential risk Model for Lyme disease. Pilot Study Area

E N D
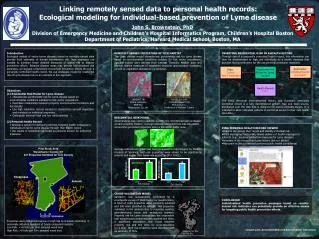
6.5 45 44 6 43 42 5.5 41 Mean Wetness Mean Greenness 40 5 39 38 4.5 37 4 36 High Low Low High Application: Individual health promotion Data: Cohort Patient Addresses Residential risk Model for Lyme disease Pilot Study Area Westchester County, NY 337 Properties Sampled for Tick Density Chappaqua Armonk Health Record PING Linking remotely sensed data to personal health records: Ecological modeling for individual-based prevention of Lyme disease John S. Brownstein, PhD Division of Emergency Medicine and Children’s Hospital Informatics Program, Children’s Hospital Boston Department of Pediatrics, Harvard Medical School, Boston, MA Introduction Ecological models of vector-borne diseases based on remotely-sensed data provide local estimates of human transmission risk. New strategies are needed to translate these detailed measures of spatial risk to disease prevention efforts. Because disease maps may provide individualized risk estimates, we suggest a framework to promote prevention efforts through a personally controlled health record. We use landscape model for residential risk of Lyme disease risk as an example of this approach. REMOTELY SENSED INDICATORS OF TICK HABITAT The Lyme disease model characterizes peridomestic risk for Lyme disease based on environmental conditions suitable for tick vector populations. Spectral indices were derived from Landsat Thematic Mapper data and provide relative measures of vegetation structure and moisture (wetness), as well as vegetation abundance (greenness). INSERTING RESIDENTIAL RISK IN A HEALTH RECORD Through use of a personally controlled health record, this information can then be disseminated to high risk individuals as a health message that provides strong motivation for the use personal protection measures. The PING (Personal Internetworked Notary and Guardian) personally controlled record is a fully decentralized system, free and open source, distributed over the web that is designed for secure nomadic access. It is intended to allow individual patients to control all access to their own health care data • Objectives • (1) Residential Risk Model for Lyme disease • characterizes peridomestic risk for Lyme disease based on • environmental conditions suitable for tick vector populations. • Describes relationship between property environmental conditions and tick density • Use high resolution remote sensing to characterize amount vegetation and moisture on individual properties • Distinguish between high and low risk properties • (2) Personal Health Record • Develop a system for delivering tailored, targeted health messages to individuals at risk for Lyme disease through their health record • Use results of residential risk model as personal advisor for protection measures LANDSAT TM 28.5m resolution RGB-432 Westchester Co., NY TASSELED-CAP TRANSFORMATION PCA analysis: Greenness & Wetness Layers RESIDENTIAL RISK MODEL Zonal analysis was used to spatially quantify the remotely sensed landscape at each property location. Average wetness and greenness was calculated around the geocoded properties using a 90mx90m buffer area. Average wetness and greenness were compared to risk category by Multiple Analysis of Variance. High-risk properties were shown to be significantly greener and wetter than lower-risk properties (P < 0.001). • PING PERSONAL HEALTH RECORD VIEWER • Patients can access their record and identify individual risk • PING messaging functionality allows delivery of health messages to patients (e.g.: personal protection measures for Lyme disease) • Annotate in the record their Lyme history (but not delete) • May grant access to selected portions (public health surveillance) • Properties were categorized as low or high risk by K-means clustering of seasonally adjusted densities of Ixodes scapularis nymphs: • Low Risk: <=6 ticks per 50m sampled wood area • High Risk: >6 ticks per 50m sampled wood area greenness wetness Tick Density Tick Density CROSS-VALIDATION MODEL Validation was subsequently performed by a countywide survey of Westchester by questionnaire. A total of 1000 properties were randomly selected and 300 were stratified by laittude. 346 properties remained in the analysis due to response number, georeferencing issues and ambiguous answers. Property risk for Lyme disease was the respondent had experienced peridomestically-aquired tick bites. A significant association was found between property risk and tick bites by cross-tabulation (p<0.001). High risk properties were identified with an accuracy of 76%. CONCLUSION Individualized health promotion messages based on remote-sensed risk indicators can potentially provide an effective means for targeting public health prevention efforts. Contact: john_brownstein@harvard.edu for further information Acquired Tick Bite # No Tick Bite #