Download

1 / 69
690 likes | 942 Vues
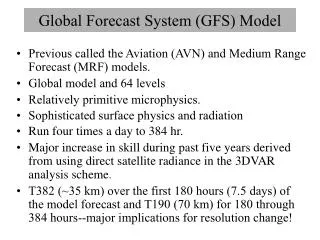
Review of GFS Forecast Skills in 2013. Fanglin Yang IMSG - Environmental Modeling Center National Centers for Environmental Prediction.

E N D
Review of GFS Forecast Skills in 2013 Fanglin Yang IMSG - Environmental Modeling Center National Centers for Environmental Prediction Acknowledgments : All NCEP EMC Global Climate and Weather Modeling Branch members are acknowledged for their contributions to the development and application of the Global Forecast Systems. Disclaimer: The review does not cover all aspects of the complex system, and is biased towards personal experience. The review is focused more on problems and issues of the forecast system rather than on general performance skill scores.
Outline • Major GFS changes in recent years • Forecast skill scores • AC and RMSE • Hurricane Track and Intensity • Precipitation • Surface 2-m temperature • Verification Against Rawinsonde Observations 3. Summary and Discussion
Change History of GFS Configurations Vertical layers double every ~11 years; change of horizontal resolution is rapid; sigma-Eulerian was used for 27 years ! 3 Source http://www.emc.ncep.noaa.gov/gmb/STATS/html/model_changes.html maintained by M. Iredell, P. Caplan, F. Yang
Major GFS Changes • 3/1999 • AMSU-Aand HIRS-3 data • 2/2000 • Resolution change: T126L28 T170L42 (100 km 70 km) • Next changes • 7/2000 (hurricane relocation) • 8/2000 (data cutoff for 06 and 18 UTC) • 10/2000 – package of minor changes • 2/2001 – radiance and moisture analysis changes • 5/2001 • Major physics upgrade (prognostic cloud water, cumulus momentum transport) • Improved QC for AMSU radiances • Next changes • 6/2001 – vegetation fraction • 7/2001 – SST satellite data • 8/200 – sea ice mask, gravity wave drag adjustment, random cloud tops, land surface evaporation, cloud microphysics…) • 10/ 2001 – snow depth from model background • 1/2002 – Quikscat included Logged by S. Lord and F. Yang
Major GFS Changes (cont’d) • 11/2002 • Resolution change: T170L42 T254L64 (70 km 55 km) • Recomputed background error • Divergence tendency constraint in tropics turned off • Next changes • 3/2003 – NOAA-17 radiances, NOAA-16 AMSU restored, Quikscat 0.5 degree data • 8/2003 – RRTM longwave and trace gases • 10/2003 – NOAA-17 AMSU-A turned off • 11/2003 – Minor analysis changes • 2/2004 – mountain blocking added • 5/2004 – NOAA-16 HIRS turned off • 5/2005 • Resolution change: T254L64 T382L64 ( 55 km 38 km ) • 2-L OSU LSM 4-L NOHA LSM • Reduce background vertical diffusion • Retune mountain blocking • Next changes • 6/2005 – Increase vegetation canopy resistance • 7/2005 – Correct temperature error near top of model
Major GFS Changes (cont’d) • 8/2006 • Revised orography and land-sea mask • NRL ozone physics • Upgrade snow analysis • 5/2007 • SSI (Spectral Statistical Interpolation) GSI ( Gridpoint Statistical Interpolation). • Vertical coordinate changed from sigma to hybrid sigma-pressure • New observations (COSMIC, full resolution AIRS, METOP HIRS, AMSU-A and MHS) • 12/2007 • JMA high resolution winds and SBUV-8 ozone observations added • 2/2009 • Flow-dependent weighting of background error variances • Variational Quality Control • METOP IASI observations added • Updated Community Radiative Transfer Model coefficients • 7/2010 • Resolution Change:T382L64 T574L64 ( 38 km 23 km ) • Major radiation package upgrade (RRTM2 , aerosol, surface albedo etc) • New mass flux shallow convection scheme; revised deep convection and PBL scheme • Positive-definite tracer transport scheme to remove negative water vapor
Major GFS Changes (cont’d) • 05/09/2011 • GSI: Improved OMI QC; Retune SBUV/2 ozone ob errors; Relax AMSU-A Channel 5 QC; New version of CRTM 2.0.2 ; Inclusion of GPS RO data from SAC-C, C/NOFS and TerraSAR-X satellites; Inclusion of uniform (higher resolution) thinning for satellite radiances ; Improved GSI code with optimization and additional options; Recomputed background errors; Inclusion of SBUV and MHS from NOAA-19 and removal of AMSU-A NOAA-15 . • GFS: New Thermal Roughness Length -- Reduced land surface skin temperature cold bias and low level summer warm bias over arid land areas; Reduce background diffusion in the Stratosphere . • 5/22/2012 • GSIHybrid EnKF-3DVAR : A hybrid variational ensemble assimilation system is employed. The background error used to project the information in the observations into the analysis is created by a combination of a static background error (as in the prior system) and a new background error produced from a lower resolution (T254) Ensemble Kalman Filter. • Other GSI Changes: Use GPS RO bending angle rather than refractivity; Include compressibility factors for atmosphere ; Retune SBUV ob errors, fix bug at top ; Update radiance usage flags; Add NPP ATMS satellite data, GOES-13/15 radiance data, and SEVERI CSBT radiance product ; Include satellite monitoring statistics code in operations ; Add new satellite wind data and quality control. • 09/05/2012 • GFS : A look-up table used in the land surface scheme to control Minimum Canopy Resistance and Root Depth Number was updated to reduce excessive evaporation. This update was aimed to mitigate GFS cold and moist biases found in the late afternoon over the central United States when drought conditions existed in summer of 2012.
Major GFS Changes (cont’d) • 2013 - GFS was moved from IBM CCS to WCOSS supercomputers. They two systems have different architectures. • - GSI change on August 20: New satellite data, including METOP-B, SEVIRI data from Meteosat-10, and NPP CrIS data. 8
Outline • Major GFS changes in recent years • Forecast skill scores • AC and RMSE • Hurricane Track and Intensity • Precipitation • Surface 2-m temperature • Verification Against Rawinsonde Observations 3. Summary and Discussion 9
Annual Mean 500-hPa HGT Day-5 Anomaly Correlation CDAS is a legacy GFS (T64) used for NCEP/NCAR Reanalysis circa 1995. CFSR is the coupled GFS (T126) used for reanalysis circa 2006. After 2010, CDAS and CFSR scores have been dropping – is the nature getting more difficult to predict?
Annual Mean 500-hPa HGT Day-5 Anomaly CorrelationGFS minus CDAS Best Year, For both NH and SH After 1999, the gain in SH is much faster than that in NH. Is it an indication of better use of satellite observations in DA?
Annual Mean 500-hPa HGT Day-5 Anomaly CorrelationGFS minus CFSR Best Year, For both NH and SH
Annual Mean NH 500hPa HGT Day-5 AC • All models except CFSR and CDAS were better in 2013 than in 2012.
Annual Mean SH 500hPa HGT Day-5 AC • All models were better in 2013 than in 2012. CMC caught up with GFS. 14
Reformatted Bob Kistler Diagram Day at which forecast loses useful skill (AC=0.6) N. Hemisphere 500hPa height calendar year means 8.08d Forecast day Increase is about one day per decade
Useful Forecast Days for Major NWP Models, NH GFS lags ECM by ~0.3 day GFS lags ECM by ~0.4 day http://www.emc.ncep.noaa.gov/gmb/STATS_vsdb/longterm/ by F. Yang
Useful Forecast Days for Major NWP Models, SH GFS lags ECM by ~0.7 day GFS lags ECM by ~0.7 day
Twenty bins were used to count for the frequency distribution, with the 1st bin centered at 0.025 and the last been centered at 0.975. The width of each bin is 0.05. AC Frequency Distribution GFS NH Reduced # of low ACs • Jan 2000: T126L28 T170L42 • May 2001: prognostic cloud • Oct 2002: T170L42 T254L64 • May 2005: T254L64 T382L64; • 2-L OSU LSM 4-L NOHA LSM • May 2007: SSI GSI Analysis; • Sigma sigma-p hybrid coordinate • July 2010: T382L64 T574L64; Major Physics Upgrade • May 2012: Hybrid-Ensemble 3D-VAR Data Assimilation
AC Frequency Distribution GFS SH Increased # of high ACs Reduced # of low ACs • Jan 2000: T126L28 T170L42 • May 2001: prognostic cloud • Oct 2002: T170L42 T254L64 • May 2005: T254L64 T382L64; • 2-L OSU LSM 4-L NOHA LSM • May 2007: SSI GSI Analysis; • Sigma sigma-p hybrid coordinate • July 2010: T382L64 T574L64; Major Physics Upgrade • May 2012: Hybrid-Ensemble 3D-VAR Data Assimilation
AC Frequency Distribution ECMWF NH
AC Frequency Distribution ECMWF SH
Jan 2000: T126L28 T170L42 • May 2001: prognostic cloud • Oct 2002: T170L42 T254L64 • May 2005: T254L64 T382L64; • 2-L OSU LSM 4-L NOHA LSM • May 2007: SSI GSI Analysis; • Sigma sigma-p hybrid coordinate • July 2010: T382L64 T574L64; Major Physics Upgrade • May 2012: Hybrid-Ensemble 3D-VAR Data Assimilation
NH: slight decrease SH: nice increase • Jan 2000: T126L28 T170L42 • May 2001: prognostic cloud • Oct 2002: T170L42 T254L64 • May 2005: T254L64 T382L64; • 2-L OSU LSM 4-L NOHA LSM • May 2007: SSI GSI Analysis; • Sigma sigma-p hybrid coordinate • July 2010: T382L64 T574L64; Major Physics Upgrade • May 2012: Hybrid-Ensemble 3D-VAR Data Assimilation
Jan 2000: T126L28 T170L42 • May 2001: prognostic cloud • Oct 2002: T170L42 T254L64 • May 2005: T254L64 T382L64; • 2-L OSU LSM 4-L NOHA LSM • May 2007: SSI GSI Analysis; • Sigma sigma-p hybrid coordinate • July 2010: T382L64 T574L64; Major Physics Upgrade • May 2012: Hybrid-Ensemble 3D-VAR Data Assimilation
Tropical Wind RMSE, 00Z Cycle, Multiple NWP Models 850 hPa 200 hPa July2010 T574 GFS Implementation largely reduced GFS wind RMSE Still worse than ECM and UKM at 200 hPA
Tropical Wind RMSE, GFS 4 Cycles 850 hPa 200 hPa 00Z: RMS reduction after 2010; 12Z and 18Z better than 00Z 00Z the best 27
500hPa Height AC, GFS 4 Cycles NH SH 28 00Z cycle has the best score in both NH and SH; 06Z and 18Z the worst
Data Source: http://www.nco.ncep.noaa.gov/sib/counts/ Nov2006 • 06Z data count is always about 10% less (primarily ACARS) than other cycles. • The counts for 00Z , 12Z and 18Z are similar except that after March 2011 the 12Z count started to deviate from the 00Z and 18Z cycles. 29
Data Source: http://www.nco.ncep.noaa.gov/sib/counts/ 2006 2007 2008 2009 2010 2011 2012 • No significant difference in the number of satellite data assimilated in the GFS forecast system among the four cycles. • Not all differences in forecast skills among GFS 4 cycles can be explained by data counts. 30
Outline • Major GFS changes in recent years • Forecast skill scores • AC and RMSE • Hurricane Track and Intensity • Precipitation • Surface 2-m temperature • Verification Against Rawinsonde Observations 3. Summary and Discussion 31
2013 Atlantic Hurricanes, one of the most quiet year http://www.wikipedia.org NOAA’s Atlantic Hurricane Season Outlook : a 70 percent likelihood of 13 to 20 named storms, of which 7 to 11 could become hurricanes, including 3 to 6 major hurricanes (Category 3, 4 or 5). www.nhc.noaa.gov/
2012 Atlantic Hurricanes www.nhc.noaa.gov/ http://www.wikipedia.org
2013 Eastern Pacific Hurricanes http://www.wikipedia.org www.nhc.noaa.gov/
2012 Eastern Pacific Hurricanes www.nhc.noaa.gov/ http://www.wikipedia.org
2013 Atlantic Hurricane Track and Intensity Errors GFS track is as good as HWRF track, GFS intensity still falls behind HWRF AVNO = GFS
2013 Eastern Pacific Hurricane Track and Intensity Errors GFS track is as good as HWRF track, GFS intensity still falls behind HWRF AVNO = GFS
Hurricane Track and Intensity Forecast ErrorsNCEP GFS : 2001 ~ 2013
Fcst Hour Has been always improving ……, but 2013 track is worse than 2012 !!! 39
2013 intensity was improved Intensity further improved in 2013, likely due to the hybrid ENKF-3DVAR GSI Implementation in May 2012
Fcst Hour 2013 intensity is slightly degraded
Outline • Major GFS changes in recent years • Forecast skill scores • AC and RMSE • Hurricane Track and Intensity • Precipitation • Surface 2-m temperature • Verification Against Rawinsonde Observations 3. Summary and Discussion 43
2013 Annual Mean CONUS Precipitation Skill Scores, 0-72 hour Forecast BIAS=1 is perfect Larger ETS is better • ECMWF has the best ETS, but it tends to underestimate heavy rainfall events. • GFS has the lowest ETS score; GFS underestimated heavy rainfall events
GFS CONUS Precipitation Skill Scores, Annual Mean, 2009 ~ 2013 GFS ETS was significantly improved after the 2010 T574GFS implementation. The score did not vary much in the past five years. 2013 is slightly better than 2012; however, BIAS was increased for moderate rainfall events.
GFS tends to produce more popcorn rainfall than does ECMWF, especially over high terrains. 25km res 27km res 13km res 100km res 46 http://www.emc.ncep.noaa.gov/gmb/STATS_vsdb/
A Case of Central US Flood 08/03/2013: GFS underestimated the intensity and moved too fast away from Missouri to Illinois. 47 http://www.emc.ncep.noaa.gov/gmb/STATS_vsdb/
Animation of GFS 3-day Forecast and Gauge Observed 24h Accumulated Rainfall for June-July-August 2013 GFS is 60-84 hour forecast from the 00Z cycle. While CPC obs is at 0.125 deg resolution, GFS forecast data used here are only at 1-deg resolution. Therefore, pay more attention to the phase and occurrence and less attention to intensity. 48
Outline • Major GFS changes in recent years • Forecast skill scores • AC and RMSE • Hurricane Track and Intensity • Precipitation • Surface 2-m temperature • Verification Against Rawinsonde Observations 3. Summary and Discussion 49
CONUS East T2m Verified against Surface Station Observations • Nighttime cold bias had been persistent for all years, although in 2013 the cold bias was slightly reduced. • The nighttime cold bias is found mostly in Spring and Fall seasons. 2011 6-hrly 2012 6-hrly 2013 3-hrly www.emc.ncep.noaa.gov/gmb/wx24fy/g2o/