Download
1 / 21
210 likes | 386 Vues
Graphic Interface for Organizations in IPDS. Presentation 2 Donald Lee. Overview. Action Items Project Plan Architectural Design Formal Specifications Technical Inspection Checklist Test Plan Prototype Demonstration Technical Risks Questions/Comments. Action Items.

E N D
Graphic Interface for Organizations in IPDS Presentation 2 Donald Lee
Overview • Action Items • Project Plan • Architectural Design • Formal Specifications • Technical Inspection Checklist • Test Plan • Prototype Demonstration • Technical Risks • Questions/Comments
Action Items • Requirement Changes for Project • Focused on the Graphical Interface for Organization Tree in Simulation. • Moved away from creating the IPDS from ground up. • Modified COCOMO and Gnatt Chart to fit new requirements
Adjusted COCOMO Estimates • Effort Applied (E) = = 3.39 • Development Time (D) = = 3.96 Months
Project Plan – Phase 3 Deliverables • Final Source Code • Component Design • User Manuel • Assessment Evaluation • Testing Evaluation • Technical Inspection Letters • Project Evaluations • References
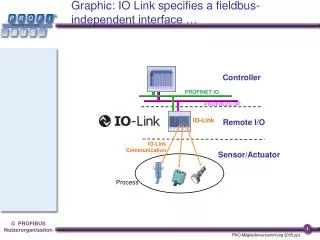
Architectural Design • 3 Main Components • Follows Model-View-Presenter Architeture. • IPDS (Model) • Runs the Simulation and contains Agent Information • Simulation Presenter • Provides the logic behind the View Component • Reads Model Information and Passes it to the View Component • Simulation View • GUI Interface (Using Java Forms and Panels) • Provides Graphical Interface for Organization Tree in Simulation • Allows user to interact with graph and request additional information (each agent status, name of IPDS, etc.) • Emphasis on View and Presenter • Model provided already provided.
Test Plan • Black Box Testing for All Test Cases. • Graph and agent information panel used to determine outputted result and compared to expected result. • Focused on the SimulationPresenter and SimulationView. • 6 Test Case to Test each Display Functionality and Specific Functionality as well as Scalability
Prototype Demonstration • Creates Graph from the IPDS Model through the Presenter • Includes creating each vertex to represent each IPDS. • Includes creating each edge between each connection • Mouse Selection Functionality and Drop Down Box for User Interaction.
Technical Risks • Listeners and Observers • Implementing Listeners to monitor each IPDS object