Download
1 / 28
300 likes | 459 Vues
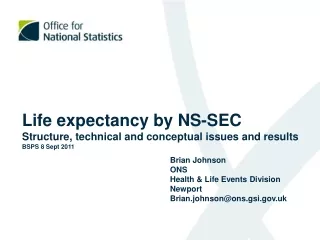
Life expectancy by NS-SEC Structure, technical and conceptual issues and results BSPS 8 Sept 2011. Brian Johnson ONS Health & Life Events Division Newport Brian.johnson@ons.gsi.gov.uk. Introduction. Why life expectancy by NS-SEC? What is NS-SEC and how is it derived?

E N D
Life expectancy by NS-SEC Structure, technical and conceptual issues and resultsBSPS 8 Sept 2011 Brian Johnson ONS Health & Life Events Division Newport Brian.johnson@ons.gsi.gov.uk
Introduction • Why life expectancy by NS-SEC? • What is NS-SEC and how is it derived? • Why is the ONS Longitudinal Study vital to this analysis? • Main technical problems and approach to them • Conceptual concerns • Summary results
Background • ONS has produced life expectancy by Registrar General’s social class (RGSC) for the period 1972-2005 • In 2001 RGSC was replaced by NS-SEC for official statistics • Need to produce life expectancy by NS-SEC • This is how it was done
Registrar General’s social class Non-manual I Professional II Managerial and technical IIIN Non-manual skilled Manual IIIM Manual skilled IV Manual semi-skilled V Manual unskilled
Life expectancy at birth by social class, for male & females, England and Wales, 1972-2005. Non-manual vs Manual Males Females Source: ONS Longitudinal study
What is NS-SEC? • Socio-economic classification based on occupation • Conceptually based on ‘employment relations’ • Job security/prospects/autonomy • ‘service contract’ relationship • ‘labour contract’ relationship
NS-SEC operational and analytical categories Source: Rose D and Pevalin D (ed) (2003) A Researcher’s Guide to the National Statistics Socio-economic Classification.
Part of NS-SEC derivation matrix Source: ONS (2002): The NS-SEC User Manual
Period and Cohort Life expectancy • Period life expectancy (shown here) reflects mortality rates prevailing at all ages during calendar period to which it refers • Therefore ‘life expectancy at birth’ for child born in 2004 is the number of years that child could expect to live if age-specific mortality rates stayed as in 2004 • Cohort life expectancy allows for anticipated future changes in mortality rates – projection implies element of subjectivity
Entries 1971-2008 New Births 272,000 Immigrations 174,000 Exits 1971-2008 Deaths 239,000 Embarkations 40,000 1981 534,000 sample members found at 1981 Census 1991 543,000 sample members found at 1991 Census Events: 1971-2008 Births to sample women 260,000 Births to sample men 49,500 Infant Deaths 2,200 Widow(er)hoods 82,000 Cancer registrations114,000 LS Structure 1971 Original sample: 530,000 members; selected from 1971 Census 2001 540,000 sample members found at 2001 Census
What can the LS offer the study of life expectancy by social classification? • Based on census returns and administrative sources – low levels of ‘attrition’ (compared with survey data) • Can attribute social indicator (eg. social class/occupation) several years beforedeath – no need to rely on death registration • Eliminates numerator-denominator bias - uses actual person-years at risk as denominator
Structure of Life Expectancy by NS-SEC project M A T R I C E S 81 91 01 NS- SEC D E R I V A T I O N Members’ Occupation/emp status at census 81,91,01 Cancelled Ciphers Own NS-SEC Losses to Follow up Deaths & Pyrs program NS-SEC Classifica-tion program Non-members’ Occupation/emp status at census 81,91,01 Father’s Mother’s Spouse’s NS-SEC Age-specific mortality rates Father’s Mother’s NS-SEC At birth New births 80’s,90’s,00’s Father/mother Occ/emp status Life Tables NS-SEC80 Derivation Matrix project
Components of the project • Construct “NS-SEC80” derivation matrix using 1981 occupational classification and employment status to produce (reduced) NS-SEC classification for 1981 Census • Construct ‘own’ NS-SEC at each census where present 3. Construct father’s, mother’s and spouse’s NS-SEC at 1981, 1991 & 2001 censuses where present, using LS non-members file 4. Construct father’s and mother’s NS-SEC for 1980’s, 1990,s and 2000’s new births 5. Construct hierarchical scheme for assigning ‘sec’ to each LS member, using own or father’s, mother’s, or spouse’s class 6. Adapt rule-based programs to obtain age-specific mortality rates by NS-SEC
Technical issues • No one-to-one mapping of CO80 to SOC90 • There is a bridge coding which applies to both 1981 and 1991 • But 1981 Census occupations not classified by it!
Comparability of OPCS CO80 occupation codes and SOC90 unit groups SOC90 CO80 46% 16% 38% Source: OPCS (1991) “Standard Occupational Classification”, Volume 3, HMSO
Solutions • Map those occupations which have exact or near-exact linkage • Add other occupations which are not uniquely linked but map to the same standard NS-SEC analytic groups • Use empirically based rules to estimate the rest (approx 3% of population)
Part of NS-SEC80 derivation matrix NS-SEC analytic classes
Conceptual problem • NS-SEC was designed for the economic structure of 2000 not 1980 • May be criticised as conceptually invalid • But empirically, it works!
Period life expectancy – males at birth Source ONS Longitudinal Study
Period life expectancy – females at birth Source ONS Longitudinal Study
Period life expectancy – men aged 65 Source ONS Longitudinal Study
Period life expectancy – women aged 65 Source ONS Longitudinal Study
Summary • ONS has a series of trends in life expectancy by (RG) social class • Has now developed a series by NS-SEC also using the ONS Longitudinal Study (published Feb 2011*) • Similar pattern of socio-economic gradient apparent in results *For full description of methods and context of results see Health Statistics Quarterly volume 49 http://www.ons.gov.uk/ons/rel/hsq/health-statistics-quarterly/trends-in-life-expectancy-by-the-national-statistics-socio-economic-classification-1982-2006/health-inequalities-in-the-21st-century.pdf