Download
1 / 8
80 likes | 263 Vues
Name:. Mole Ratio of Reactants Laboratory . 35 pts. For your laboratory report, please turn in just answers to the questions on the last slide, in addition to the graph. Handwritten responses will not be accepted but the data should be graphed by hand. Introduction.

E N D
Name: Mole Ratio of Reactants Laboratory 35 pts • For your laboratory report, please turn in just answers to the questions on the last slide, in addition to the graph. Handwritten responses will not be accepted but the data should be graphed by hand.
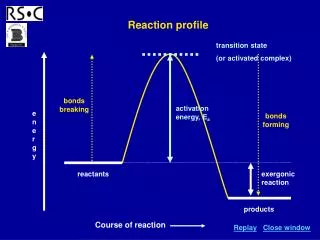
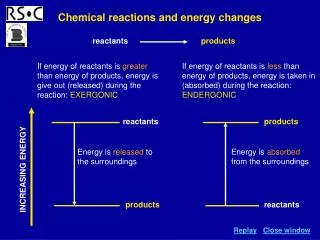
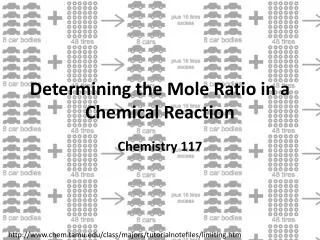
Introduction When a chemical equation for a reaction is balanced it provides the mole ratio of reactants and products. When the formulas of the reactants and products are known, the equation for the reaction can be readily balanced and the ratios calculated. When the formulas of the products are not known, the equation cannot be balanced and experimental measurements must be used to find the mole ratios. Using the method of continuous variation, two solutions are combined in various volume ratios. In order to select the volume ratio that produces the most product or consumes the most reactants, we must find an empirical method which is proportional to the amount of reaction that occurs. This might be volume of gas produced, intensity of color of product produced, or the weight of a precipitate formed. The reaction selected for this experiment is exothermic and the optimum ratio produces the greatest temperature change.
Objective In this experiment the total numbers of moles of reactants are kept constant while varying each reactant. The measurements are made on each different ratio until the optimum ratio, the stoichiometric ratio in the equation, is made which consumes the greatest amount of reactants, produces the greatest amount of product and produces the greatest amount of heat. This experiment involves accurate volumetric measurements and monitoring reaction temperatures. The data is collected graphed and analyzed during the lab so that additional measurements may be taken if needed.
Chemicals and Equipment • 1L O.5M sodium hypochlorite (NaClO) solution • 1L 0.5M sodium thiosulfate (Na2S2O3) solution • 2 Styrofoam cups • 50 mL glass beaker • 50 mL graduated cylinder • thermometer • deionized water Safety notes: sodium hypochlorite is bleach. Keep off of clothing. All solutions are harmful to skin and eyes but can be flushed down the drain with water. Work under a hood to control fumes.
Procedure 1.) Take temperature measurements of each solution, average them, and record as the initial temperature. 2.) Pour 5mL of sodium hypochlorite into a 50mL beaker nested in two Styrofoam cups. Add 45mL of the sodium thiosulfate solution to the beaker. Stir the mixture with a thermometer and record the highest temperature reached. 3.) Empty the beaker into the sink, flush with water, and rinse with deionized water. 4.) Pour 10mL of NaClO and 40mL of the Na2S2O3 solution into the beaker and record the highest temperature reached. 5.) Continue with the ratios of: NaClO Na2S2O3 20mL 30mL 30mL 20mL 40mL 10mL 45mL 5mL
Data Tables Complete theData Tables. Print out the graph template on the following slide. Then, plot the data points by hand and draw a best-fit line (10 pts)
Molar Ratio vs. Temperature Change Graph 35 30 25 20 Temperature Change (̊C) 15 10 5 0 NaClO 0 5 10 15 20 25 30 35 40 45 50 Na2S2O3 50 45 40 35 30 25 20 15 10 5 0 Volume Ratios (ml)
Laboratory Report Guidelines Data Analysis 1) (5 pts) Write the equation (complete or net ionic) for the reaction in this experiment. 2) (5 pts) Which is the limiting reactant along the upward sloping line of the graph? Which is the limiting reactant along the downward sloping line? Conclusion 1) (5 pts) The intersection of the two lines on your graph is important. Think about what this might mean and discuss the significance. Error Analysis 1) (5pts) How might our data have been affected if we hadn’t kept our beaker in the Styrofoam cups? Be specific. 2. (5pts) Which measurement (temperature or volume) limits the precision of the data obtained in the experiment? Explain.