Download
1 / 6
60 likes | 212 Vues
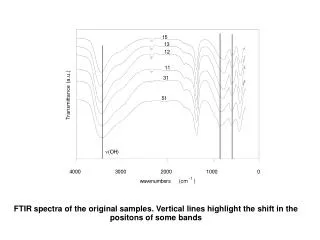
FTIR spectra of the original samples. Vertical lines highlight the shift in the positons of some bands. DTA curves for the samples studied, recorded in N 2 and in O 2. Electronic spectra (diffuse reflectance) of the samples studied.

E N D
FTIR spectra of the original samples. Vertical lines highlight the shift in the positons of some bands
DTA curves for the samples studied, recorded in N2 and in O2
Electronic spectra (diffuse reflectance) of the samples studied
Nitrogen adsorption isotherms for the samples studied. Solid symbols: adsorption, empty symbols: desorption
FTIR spectra of the samples calcined for 3 h at 500 °C in air
Percentage changein specific surface area and pore volume upon calcination of CuCo samples at 300 °C for 2 h in air.