SlideServe
Menu
Préférences
© SlideServe · v2026

F luorescence Correlation Spectroscopy

aron avatar
21 diapositives · 430 Views · Jul 15, 2014

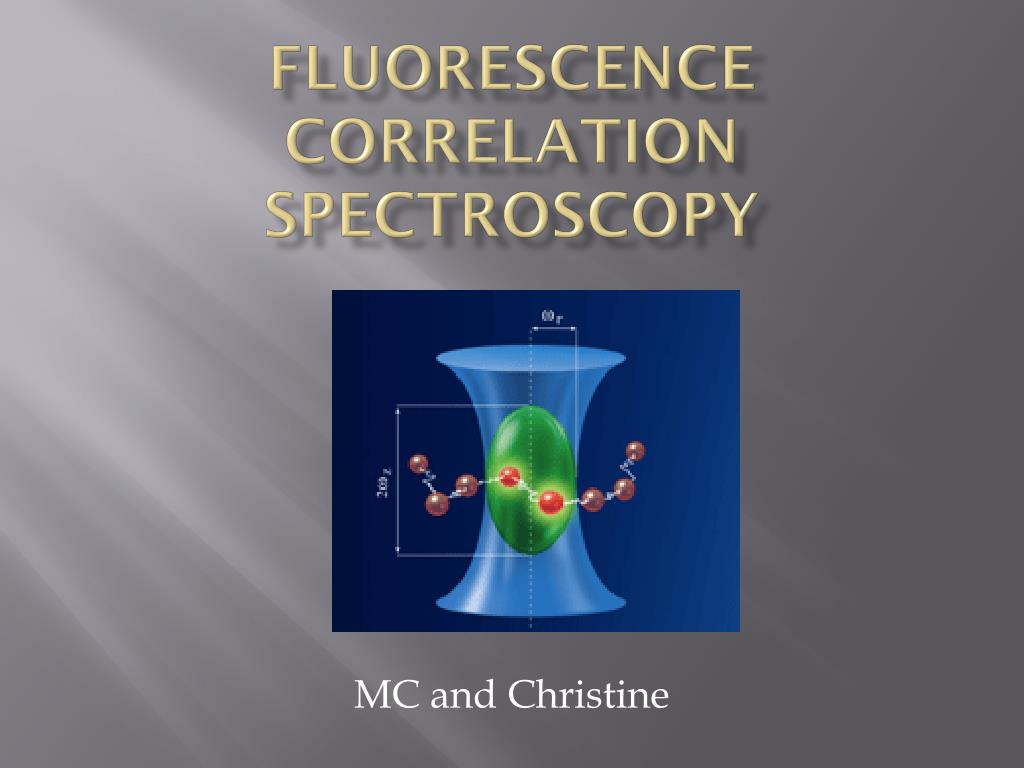
F luorescence Correlation Spectroscopy. MC and Christine. An Introduction. FCS is a high-resolution spatial and temporal analysis of very low concentrations of biomolecules
F luorescence Correlation Spectroscopy - slide 1
01 / 21F luorescence Correlation Spectroscopy
1 / 17

Télécharger la présentation

F luorescence Correlation Spectroscopy
Une image / un lien ci-dessous est fourni (tel quel) pour télécharger la présentation

Politique de téléchargement : le contenu du site vous est fourni TEL QUEL pour votre information et votre usage personnel ; il ne peut être vendu, concédé sous licence ni partagé sur d’autres sites sans l’accord de son auteur.Le contenu vous est fourni TEL QUEL, pour votre information et votre usage personnel uniquement. Téléchargez la présentation en cliquant sur ce lien. Lors du téléchargement, si vous ne parvenez pas à télécharger une présentation, l’éditeur a peut-être supprimé le fichier de son serveur.Pendant le téléchargement, si vous ne parvenez pas à obtenir une présentation, le fichier a peut-être été supprimé par l’éditeur.

F I N

Plus de contenu associé

Transcription de la présentation
  1. Fluorescence Correlation Spectroscopy MC and Christine

  2. An Introduction • FCS is a high-resolution spatial and temporal analysis of very low concentrations of biomolecules • This is done by measuring the spontaneous intensity fluctuations caused by the minute deviations of the system from equilibrium

  3. Uses • Developed in the early seventies as a way to analyze relaxation • Study the Behavior of Individual Molecules • Study Serum Biomarkers • Monitoring biological molecular association and disassociation processes

  4. What Can You Get Out of It? • Diffusion Coefficients • Hydrodynamic Radii • Average Concentrations • Kinetic Chemical Reaction Rates

  5. History • 1916 – Smoluchowski gave the first description of amplitude and temporal decay of number fluctuations in diffusion system • 1972-1974 – Magde, Elson, Webb published book on potential of FCS and first developed the technique at Cornell University • 1990 – Rigler reached single molecule detection limit on FCS • 1994 – Eigen and Rigler proposed dual color cross correlation for FCS • 2000 – FCS evolved and also dual color cross correlation made and used

  6. FCS General Principles FCS is a method in which the florescence intensity arising from a very small volume containing fluorescent molecules is correlated/analyzed to obtain information about the processes that give rise to fluctuations in the fluorescence. [1]

  7. Brownian Motion • This concept dictates the appearance and disappearance of fluorescent molecules in small observation volume. [2] http://www.realinnovation.com/commentary/archive/organizational_brownian_motion.html

  8. Technique optimization • Small number of molecules. • Large number of molecules suppress effect of fluctuations. • Low concentration is implied by 1. • Small area or cavity. One or less molecule. • Number of fluctuations is inversely related to number of molecules.

  9. Why low concentration? • Magnitude of number fluctuations = Mean square deviations

  10. Typical Set up http://en.wikipedia.org/wiki/File:Fluorescence_correlation_spectroscopy_instrument_diagram.png [2]

  11. Measurements • During FCS you measure the Fluorescent Intensity. • Data not very useful yet! • Notice that these fluctuations are caused by diffusion of fluorescent molecules through the cavity or just changes in fluorescence over time

  12. Autocorrelation Function • Goal: to make sense out of data. OR

  13. t For small t t For larger t g(t) t tc Recall: Intensity autocorrelation g(t) = <I(t) I(t + t)>t

  14. Before and After Correlation • = is the average time it takes for a molecule to diffuse through radial cavity. 1/N

  15. 2D & 3D Correlation Function 3D • r and l are radial and axial dimensions of volume. • For large r/l, same as 2D.

  16. Diffusion Coefficient • From autocorrelation plot we get N and • The relationship between diffusion time and coefficient is; • r is the radius of cavity – can be measured. • Therefore, we can find D!

  17. Different Mobility Modes Model autocorrelation curves for different kinds of particle motion [2]

  18. Dual-Color Fluorecense Cross-Correlation Spectroscopy

  19. G + R GR

  20. Cross-correlation curves at different time points during an endonucleolytic cleavage reaction. Dotted lines are the original data. Fitted curves are given in solid lines. During the reaction the cross-correlation amplitude, which is a measure of the reaction progress, gradually decreases.

  21. References • Methods in Biomolecular Physics, Serdyuk and SZ² • http://www.biophysics.org/Portals/1/PDFs/Education/schwille.pdf • http://research.stowers-institute.org/microscopy/external/Technology/FCS/index.htm • http://www.invitrogen.com/site/us/en/home/References/Molecular-Probes-The-Handbook/Technical-Notes-and-Product-Highlights/Fluorescence-Correlation-Spectroscopy-FCS.html • http://vohweb.chem.ucla.edu/voh/classes%5Cwinter09%5C221AID232%5CFCS.pdf • http://www.biophysics.org/Portals/1/PDFs/Education/schwille.pdf