Significance Curves
Significance Curves. Cluster Generation Calls. Ward Clustering (where X.csv contains peptide hit counts across ORFs/fractions for GMPA score significant ORFs for a given metal) X <- read.csv(“X.csv", head=TRUE, row.names=1) X[X>1]<-1 d <- dist(X) hc <- hclust(d, "ward")
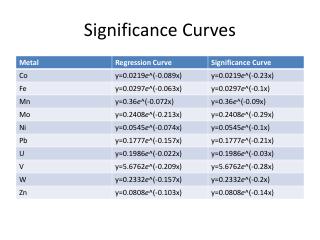

Significance Curves
E N D
Presentation Transcript
Cluster Generation Calls • Ward Clustering (where X.csv contains peptide hit counts across ORFs/fractions for GMPA score significant ORFs for a given metal) • X <- read.csv(“X.csv", head=TRUE, row.names=1) • X[X>1]<-1 • d <- dist(X) • hc <- hclust(d, "ward") • cutreeHybrid (through cutreeDynamic wrapper) • cutreeDynamic(hc, cutHeight = NULL, minClusterSize = 6, method = "hybrid", deepSplit = 3, pamStage = TRUE, distM = as.matrix(d), maxDistToLabel = 0, verbose = 0); Note: cutreeHybrid as called will in some cases return clusters or unlabeled groupings smaller than “minClusterSize” (e.g. see Co clustering) as explained in supplementary material to Langfelder et al.