Download
1 / 3
30 likes | 179 Vues
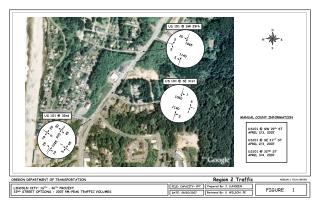
N. W. E. S. US 101 @ SW 29th. 20. 5. 1065. 5. 1140. 5. US 101 @ SE 31st. 1. 1060. 5. 1140. 1. US 101 @ 32nd. 5. MANUAL COUNT INFORMATION. US101 @ SW 29 th ST APRIL 2/3, 2007 US101 @ SE 31 ST ST APRIL 2/3, 2007 US101 @ 32 ND ST APRIL 3/4, 2007. 50. 25. 45. 0. 975.

E N D
N W E S US 101 @ SW 29th 20 5 1065 5 1140 5 US 101 @ SE 31st 1 1060 5 1140 1 US 101 @ 32nd 5 MANUAL COUNT INFORMATION US101 @ SW 29th ST APRIL 2/3, 2007 US101 @ SE 31ST ST APRIL 2/3, 2007 US101 @ 32ND ST APRIL 3/4, 2007 50 25 45 0 975 10 65 1025 25 1 5 10 Region 2 Traffic OREGON DEPARTMENT OF TRANSPORTATION REGION 2 TECH CENTER Prepared By: J. LUNDEEN FILE: CAPACITY~.PPT LINCOLN CITY: 16TH – 36TH PROJECT 32ND STREET OPTIONS - 2007 PM-PEAK TRAFFIC VOLUMES FIGURE 1 Reviewed By: S. WILSON, PE DATE: 08/20/2007
N W E S US 101 @ SW 29th 20 5 1110 5 1180 5 US 101 @ SE 31st 1 1100 5 1185 1 US 101 @ 32nd 5 55 25 50 0 1015 10 70 1070 25 1 5 10 Region 2 Traffic OREGON DEPARTMENT OF TRANSPORTATION REGION 2 TECH CENTER Prepared By: J. LUNDEEN FILE: CAPACITY~.PPT LINCOLN CITY: 16TH – 36TH PROJECT 32ND STREET OPTIONS - 2010 PM-PEAK TRAFFIC VOLUMES FIGURE 2 Reviewed By: S. WILSON, PE DATE: 08/20/2007
N W E S US 101 @ SW 29th 25 5 1405 5 1500 5 US 101 @ SE 31st 2 1395 5 1500 1 US 101 @ 32nd 5 65 30 60 0 1285 10 80 1355 30 2 5 15 Region 2 Traffic OREGON DEPARTMENT OF TRANSPORTATION REGION 2 TECH CENTER Prepared By: J. LUNDEEN FILE: CAPACITY~.PPT LINCOLN CITY: 16TH – 36TH PROJECT 32ND STREET OPTIONS - 2030 PM-PEAK TRAFFIC VOLUMES FIGURE 3 Reviewed By: S. WILSON, PE DATE: 08/20/2007