Bayesian Methods in Brain Imaging
Bayesian Methods in Brain Imaging. Will Penny. Thanks to Karl Friston & collaborators@. Wellcome Department of Imaging Neuroscience, University College London, UK. Institute for Adaptive and Neural Computation, University of Edinburgh, 27 January 2004. Overview.

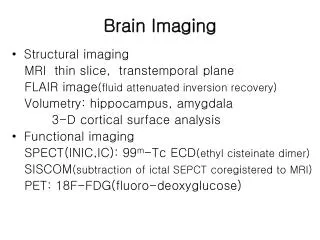
Bayesian Methods in Brain Imaging
E N D
Presentation Transcript
Bayesian Methods in Brain Imaging Will Penny Thanks to Karl Friston & collaborators@ Wellcome Department of Imaging Neuroscience, University College London, UK Institute for Adaptive and Neural Computation, University of Edinburgh, 27 January 2004.
Overview 1. Bayesian Inference 2. Brain Imaging: Functional Segregation 3. Brain Imaging: Functional Integration
Overview 1. Bayesian Inference 2. Brain Imaging: Functional Segregation 3. Brain Imaging: Functional Integration
First level of Bayesian Inference We have data, y, and some parameters, b
One parameter Likelihood and Prior Posterior Likelihood Prior Posterior Relative Precision Weighting
First level of Bayesian Inference We have data, y, and some parameters, b Parameters are of model, M, ….
First and Second Levels The first level again, writing in dependence on M: Second level of Inference: What’s the best model ?
Model Selection We need to compute the Bayesian Evidence: We can’t always compute it exactly, but we can approximate it: Log p(y|M) ~ F(M) Laplace Approximations Variational Bayes
Overview 1. Bayesian Inference 2. Brain Imaging: Functional Segregation 3. Brain Imaging: Functional Integration
image data fMRI data kernel Parameter estimates • General Linear Model • model fitting • statistic image realignment &motioncorrection smoothing normalisation designmatrix anatomicalreference Probabilistic map of activations
Face processing data R. Henson et al. (2001) Every face presented twice Part of larger study looking at factors influencing priming Press left key if famous, right key if not 24 Transverse Slices acquired with TR=2s Time series of 351 images
Modelling the Signal Assumption: Neuronal Event Stream is Identical to the Experimental Event Stream Convolve event-stream with basis functions to account for the hemodynamic response function
FIR models Size of signal Time after event 5s
FIR model Design matrix for FIR model with 8 time bins in a 20-second window Separate smoothness priors for each event type
fMRI time series model • Use a General Linear Model y = X b + e • Priors factorise into groups: p(b) = p(b1) p(b2) p(b3) • Priors in each group may be smoothness priors or Gaussians
Noise sources in fMRI 1. Slow drifts due to instrumentation instabilities 2. Subject movement 3. Vasomotor oscillation ~ 0.1 Hz 4. Respiratory activity ~ 0.25 Hz 5. Cardiac activity ~ 1 Hz Remove with ICA/PCA – but non-automatic
fMRI time series model – with Stefan Kiebel • Use a General Linear Model y = X b + e; • Priors factorise into groups: p(b) = p(b1) p(b2) p(b3) • Priors in each group may be smoothness priors or Gaussians
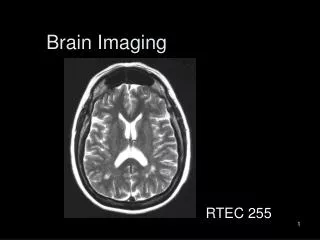
Activation Map Structural MRI Main Effect of Faces p(cTb > 0.5%)
FIR basis set Right fusiform cortex (x=45, y=-60, z=-18) FIR model average responses Larger response to first presentation – priming effect
FIR basis set Left occipital cortex (x=-33, y=-81, z=-24) FIR model average responses Priming effect only for unfamiliar faces
RFX-Event model Responses to each event of type A are randomly distributed about some typical “type A” response Design Matrix 97 parameters ! But only 24 effective parameters
Map of AR model order, p p=0,1,2,3
u1 u2 q1 q2 a b L z W a Y Current work – with Nelson Trujillo-Bareto • Spatial Priors – Laplace priors [TxN] = [TxK][KxN] + [TxN]
Maps of regression coefficients – Image (wk) TRUE ESTIMATE – w/o Spatial Prior 1024 regression coefficients but only 280 `effective’ coefficients. ESTIMATE
Overview 1. Bayesian Inference 2. Brain Imaging: Functional Segregation 3. Brain Imaging: Functional Integration
Attention to Visual Motion Stimuli 250 radially moving dots at 4.7 degrees/s Pre-Scanning 5 x 30s trials with 5 speed changes (reducing to 1%) Task - detect change in radial velocity Scanning (no speed changes) 6 normal subjects, 4 100 scan sessions; each session comprising 10 scans of 4 different condition e.g. F A F N F A F N S ................. F – fixation S – stationary dots N – moving dots A – attended moving dots Buchel et al. 1997 Experimental Factors • Photic Stimulation, S,N,A • Motion, N,A • Attention, A
Motion Sensitive Areas Mass Univariate Analyses y = Xw + e Where is effect, w, eg. of motion, significantly non-zero. Analysis of 360 images each containing 100,000 voxels, ie. 100,000 time series. New image every 3 seconds.
Network Analysis IFG SPC V5 V1 Photic Inputs and Outputs Motion Attention
DCM: A network model for fMRI Set u2 Stimuli u1 Input State Output PRIORS …. Friston et al. 2003
u 1 u 2 Z 1 Z 2 Bilinear Dynamics: Positive transients Stimuli u1 Set u2 - + Z1 - + + Z2 - -
Impulse response Hemodynamics BOLD is sluggish
…with Andrea Mechelli and Klaas Stephan Bayes factors:
Current work • Stochastic Neurodynamics – with Zoubin G. • DCMs for EEG/ERPs – with Olivier David/Lee H. • EEG-fMRI sensor fusion …………..