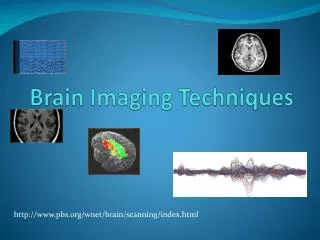
Exploring Functional Brain Imaging Techniques
Dive into the latest advances in brain imaging methods to study human mental processes through techniques such as MRI, fMRI, EEG, and more. Learn about the history of functional brain imaging and modern imaging technologies.

Exploring Functional Brain Imaging Techniques
E N D
Presentation Transcript
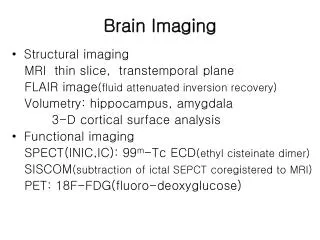
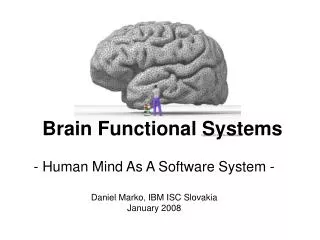
Functional Brain Imaging In the last few years there have been tremendous advances in brain imaging. This course will introduce you to the various techniques used to measure functional activity of the living brain. The focus of the course will be on the way that these new techniques can be exploited to study human mental processes.
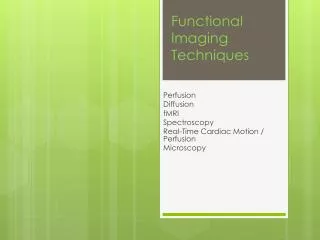
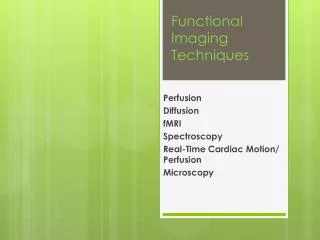
Functional Brain Imaging Imaging methods covered: • Computed tomography • PET / SPECT • MRI • fMRI – BOLD • EEG • ERP • MEG We will learn the physical and technical bases of each method and will see examples of recent research reports
History • Franz Joseph Gall: (early 1800s)mental processes emerge from the brain,are performed by functionally separate components (the components can be measured by palpable protrusions beneath the scalp = phrenology) • Throughout the 19-20th centuries, researchers have been trying to define the various functional components of the brain (neophrenology?)
History (2) • Neuropsychology: Learning about functional components by studying lessions • Broca, Wernicke (1860-1870) • Problem with this : A cogwheel with missing teeth makes noise. Is the function of a missing tooth of the cogwheel to silence the noise?
History (3) • Broca (1870) used temperature probes placed on the skull to show that specific mental activity causes increased blood flow and temperature change in key brain areas, but not in other parts of the body. • Hans Berger also studied it but turned to develop the encephalograph • Angelo Mosso (1880) observed changes in blood flow in 3 patients with skull lessions
History (4) • Whenever the patients were spoken to, began thinking actively, or was emotionally aroused there was an immediate increase in intra-cranial blood pressure
History (5) • Interest in this kind of research stopped until 1928, in part due to the lack of adequate technology, but also due to the influence of Hill, who claimed there was no relation between brain function and brain circulation • Fulton (1928) reported about a patient with an artery malformation in the occipital cortex. The blood flow in the artery could be listened to with a stethoscope.
History (6) • The changes in cortical blood flow related to the complexity of the visual task and the attention of the subject to that task
History (7) • The next big step was in the 1950s, when Seymour Kety and colleagues developed the first quantitative methods for measuring whole brain blood flow and metabolism in vivo in humans. They provided the first glimpse of quantitative changes in blood flow related directly to brain function. • The only thing needed afterwards was new computing power and algorithms which came with the invention of the CT.
History (8) “Of course we recognize that this is a very secondhand way of determining physiological activity; it is rather like trying to measure what a factory does by measuring the intake of water and the output of sewage. This is only a problem of plumbing and only secondary inferences can be made about function. We would not suggest that this is a substitute for electrical recording in terms of easy evaluation of what is going on.’’ William Landau, American Neurological Association
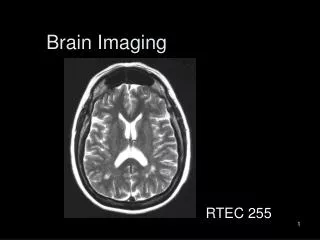
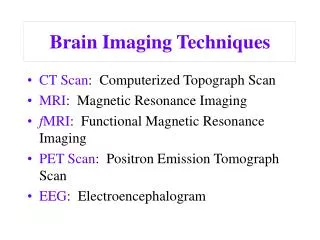
Modern Imaging TechniquesCT – based on X-raysPET MRI, fMRIEEGMEG
X-rays (Roentgen, 1895) X-rays: small wavelength = high energy Tend to act more like particles than like waves Are able to pass thru tissue. The denser tissues (bones) block more than less dense tissue (lungs). Dense=higher atomic weight Special photographic film is used. X-rays are converted into light, the more energy the darker the area. What we see in the picture are really the “shadows” that the dense tissue cast.
CT – Computed Tomography • Tomos = section, slice • Based on x-rays • Instead of taking one picture, the x-rays are rotated and a digital picture of a thin slice is computed. • Multiple slices yield a 3D image of the internal organs • Also computed axial tomography (CAT)
CT (1975). 128 x 128 matrix State of the art CT. 512 x 512 Subtle differences in tissue density can be seen
Basic Densities • Air • Fat & Lipid • Soft tissue (muscle) • Calcium (bone) • Contrast agent (e.g. iodine) • Metal
Radiological convention BOTTOMRIGHT SIDEFRONT Nuclear medicine (neurological) convention TOPRIGHT SIDEBACK LEFT is RIGHT; RIGHT is LEFT LEFT is LEFT; RIGHT is RIGHT
Axial Transaxial Transverse Y Z X