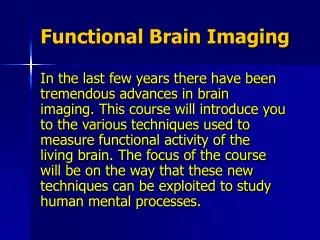
Functional Imaging Techniques
Functional Imaging Techniques. Perfusion Diffusion fMRI Spectroscopy Real-Time Cardiac Motion/ Perfusion Microscopy. 3 T Challenges. Implants Some deemed safe @ 1.5 T not cleared for 3 T Tissue Heating Doubling field strength quadruples SAR

Functional Imaging Techniques
E N D
Presentation Transcript
Functional Imaging Techniques Perfusion Diffusion fMRI Spectroscopy Real-Time Cardiac Motion/ Perfusion Microscopy
3 T Challenges • Implants • Some deemed safe @ 1.5 T not cleared for 3 T • Tissue Heating • Doubling field strength quadruples SAR • SAR α (Field Strength)2 (Flip Angle)2 (Duty Cycle) • Tissue reaches allowed limit faster • Req’s longer scan time to allow for cooling • MRI Safe equipment • designed for 1.5 T strength • Need to reevaluate equipment • ~2x louder than 1.5 T • Up to 130 dB! • Pulse Sequences may give different results • Certain artifacts worsen @ 3 T • Susceptibility • Chemical Shift 1.5 – 2 T
3 T Advantages • ↑ SNR • Conventional MRI • DWI • fMRI • ↑ Spatial resolution • Thinner slices • ↑ Matrix sizes • Superior TOF MRA • ↓ flip angles can be used • ↓ SAR • ↓ Pulsation artifacts • ↑ Resolution • ↑ SNR →↑ matrix sizes • Rival DSA • Improved MR Spectroscopy • ↑ Chemical Shift • ↑ Spectral resolution T2 sagittal 3T MRI demonstrating anterior communicating artery aneurysm
Perfusion & Diffusion Perfusion of tissues via capillary bed permits delivery of O2 & nutrients to cells & removal of waste products i.e. Flow of blood through capillary network Perfusion Imaging: Imaging blood flow in capillaries Diffusion relates to random motion of H2O molecules in tissues. Random motion of molecules from a region of high concentration to one of low concentration
Perfusion Weighted Imaging • Measure of quality of vascular supply to tissue • Regional blood volume & flow • Mean transit time • Tissue Activity • Since vascular supply usually related to metabolism • Tagging water in arterial blood during acquisition • Endogenous: Spin labeling • Saturated blood just upstream of ROI serves as tracer • EPI used • Weak SNR • Exogenous: Gd contrast • Exploits magnetic susceptibility of Gd • T2 or T2* weighting EPI • Quality of injection & timing of acquisition critical
Unenhanced sagittal T1-W MRI shows continuous inversion arterial spin-tagging technique. Spin Labeling • Solid lines: imaging slice • Dashed line: tagging plane • H2O protons in inflowing arterial blood are magnetically tagged by RF inversion pulse • Quantitative estimates of cerebral blood flow can be obtained • measuring signal changes b/t tagged images & baseline untagged images
Result Multiple slices of brain obtained using multi-slice arterial spin-tagging MR perfusion imaging technique • Images show quantitative cerebral blood flow maps. • Displayed are 5 of 10 slice locations extending from level of mid lateral ventricle to level of supraventricular white matter. • Artifacts from high flow in superior sagittal sinus are noted anteriorly and, to lesser extent, posteriorly. • Total imaging time was approximately 5 min
Perfusion Images Pre-injection Post-injection
Calculation of CBV, CBF, MTT Tissue Concentration-Time Curve Time Signal Curve Cerebral Blood Volume EPI Time Series Area Cerebral Blood Flow Height Arterial Input Function Tissue Response Function Mean Transit Time Area/Height Deconvolve
Non-Contrast CTT T2W MR Gd Contrast 43 yoman w/ acute onset left-sided weakness & visual changes; found to have left homonmoushemianopsia Increased signal right calcarine cortex Negative finding for cortical infarction MTT Map CBV Map DWI MR ↑CBV ↑MTT ↓CBV Larger area of perfusion deficit; infarction core w/ surrounding tissue at risk ↑ transit time, corresponding to infarction core w/ surrounding tissue @ risk Larger area of signal abnormality, consistent w/ infarction
Perfusion Uses • Evaluate ischemia disease • Areas of ↓perfusion on CBV map stroke • Malignancy of neoplasms • ↑Tissue metabolism/perfusion • ↑Perfusion on CBV map • Characteristic patterns seen in • Hepatocellular carcinoma • Metastases • Hemangiomas • Evaluation of tissue viability & metabolism of vascular organs • Heart • Visceral structures • Brain • Renal Artery Stenosis
Restricted vs. Free Diffusion Normal Abnormal
2 Types of DW images • Diffusion/Trace images • Normal • More H2O mobility ↑ signal loss • Injury • ↓ water mobility • Brighter than normal tissues • Apparent Diffusion Coefficient (ADC) Maps • Requires ≥ 2 acquisitions w/ different DWI parameters • Post processing calculates ADC for each voxel • Low ADC • High signal intensity on calculated image • Restricted diffusion
Strong gradients applied symmetrically about refocusing pulse • Signal difference based on mobility & directionality of H2O diffusion DWI Pulse Sequence
Sensitive indicator for early detection of ischemic injury • Drastic ↓ of ADC compared to unimpaired tissue • Can show irreversible & reversible Ischemic lesions • Potential for discriminating salvageable tissue from irreversible damage Ischemia Diffusion Coefficient Map DWI Acute ischemic stroke lesion In early stroke, soon after ischemia onset but before infarct, cells swell & absorb water from extra-cellular space. Since cells full of large molecules & membranes diffusion restricted ↓ADC
Directional Effects • Diffusion gradient can be applied along all 3 axes • All together, or Individually • Sensitize sequence to restricted diffusion along a particular axis • Example: • White Matter tracts take specific courses through brain & spinal cord • Anisotropic tissue • May enable imaging of certain WM diseases • Diffusion Tensor Imaging In this image, the axons are colored according to orientation. Fibers running between the front and back are blue, those between right and left are red, and those running between the brain's interior and exterior are green.
DWI Uses • Currently: • Brain after infarction • Differentiate: • Malignant from benign lesions • Tumor from edema & infarction • Neonatal brains • Difficult to distinguish infarction & myelinating brain • Map out myelination patterns in pre-term infants • Additional areas being explored: • Characterizing • Liver lesions • Breast & prostate tumors • Differentiating b/t • Mucin-producing pancreatic tumors & other tumors • Pathological & traumatic fractures • Imaging • Skeletal muscle injury • Left ventricular damage after myocardial infarction • Assessing bone bruising • Overlaying DWI onto T1W images • Combine structural & functional data
Diffusion-Perfusion Mismatch • Difference b/t diffusion &perfusion abnormalities provide measure of ischemic penumbra • Brain tissue at risk for infarction • Restricted diffusion → unsalvageable brain tissue • Perfusion abnormality encompasses all regions w/ ↓cerebral blood flow • Diffusion abnormality = area of ↓ perfusion • No salvageable ischemic brain tissue • Perfusion abnormality > area of restricted diffusion • Difference identifies region of reversible ischemia • Can be saved if blood flow re-established promptly
Diffusion-Perfusion Mismatch DWI PWI Blood Volume Lesion has reduced CBV T2-W Early stroke not seen Diffusion-W Clear depiction of lesion Blood Volume Large perfusion deficit Blood Volume Reduced flow around lesion Apparent Diffusion Acute stroke has low ADC
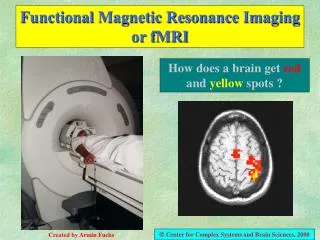
Mechanism • Exploit differences in magnetic susceptibility between oxyhemoglobin & deoxyhemoglobin • Oxyhemoglobin • Oxygen bound to hemoglobin • Magnetic properties of Fe largely suppressed • Diamagnetic • DeoxyHb • Paramagnetic • ↑ T2* decay • Endogenous contrast agent
Cerebral Metabolism • @ rest • Venous blood contains equal parts oxy- & deoxyhemoglobin • During Exercise • Metabolism ↑ • ↑ O2 needed • Concentration of oxyhemoglobin↓ • Brain • Very sensitive to ↓ concentrations of oxyhemoglobin • ↑ Blood flow to local vasculature accompanies neural activity • Local ↓ in deoxyhemoglobin • Because↑ blood flow occurs without ↑in O2 extraction
BOLD • Blood Oxygenation Level Dependent acquisition • Multiple images acquired • before stimulus • during repeated stimulus • Post-stimulus data sets Pre-stimulus data sets • Metabolic activity resulting from repeated task-induced stimulus • Repetitions to ↑SNR • If resulting signal > correlation threshold, color overlay placed on gray scale anatomic image • Pulse Sequences • High speed & T2*-weighting required • EPI • As little as 50 ms for 64 x 64 matrix • GRE • ↑ Spatial resolution • Much longer exam time • Cooperative subjects
Applications • Research • Neuropsychological studies • Cognitive studies • Clinical practice • Localizing functional regions of motricity / language for pre-operational purposes before neurosurgical excision • Determine hemispheric dominance of language • (calculate laterality index) • Assess possibilities of functional recuperation • Evaluation of stroke, pain, epilepsy, behavioral problems • Predict tubular necrosis in kidneys & Mesenteric ischemia
fMRI Alternating R/L finger tapping Black curve show correlated BOLD signals (Right) Red indicates right finger tap, Blue left.
MR Spectroscopy MRS of Brain
Description • In vivo exploration of molecular composition of tissue • Identifies metabolites in physiological /pathological processes • Proton () • Most commonly used • Highest SNR • 10-15 min added onto conventional scan • Sodium () • Phosphorus ()
Mechanism • Metabolite frequencies differ slightly • Slightlydifferent resonance frequencies due to electron cloud shielding • Frequency shift α magnet strength • Exploiting chemical shift to determine relative quantity of chemical • Relative metabolite concentrations plotted • Relative intensities vs. frequency shift • Area under peaks = quantity of metabolite
Example Spectrum Spectrum obtained in healthy liver shows frequencylocations of H2O & lipid peaks. Byconvention, x-axis plotted as downward shift relative to H2Ofrequency. frequency (ppm)
Frequency Shift • Differs for each magnetic field intensity • @1.5 T metabolite frequencies range from 63 – 64 MHz • Scale changed to ppm • Allows comparison for different magnet strengths • Reduces large unwieldy numbers to more manageable size • Calculated by: • [Metabolite frequency Reference frequency] Operating frequency of MR • Reference often water • 4.26 ppm • Advantages of higher field strengths (3.0 vs. 1.5 T) • Better separation of peaks • Higher SNR
Water/Fat Suppression • Conventional MRI • Total signal from all protons used • MRS need to suppress fat & water • These peaks are huge compared to other metabolites • ̴10,000x higher • Other peaks invisible on same scale • Suppression techniques • CHESS (chemical shift) • STIR (inversion recovery) • Often area evaluated is away from fat structures • only water needs to be suppressed
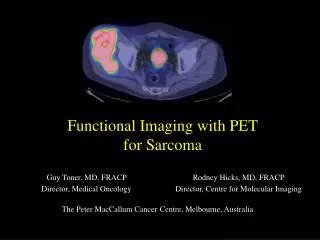
Metabolite Peak Ratios Tumor metabolites: ↑ Cell turnover causes ↑ Cho concentration Corresponding ↓of NAA peak caused by loss of healthy glioneural structures Cr peak may also ↓, depending on energy status of tumor Lipid peak sign of hypoxia-likelihood of high-grade malignancy
MRS Uses • Serially monitor biochemical changes in • Tumors • Stroke • Epilepsy • Metabolic disorders • Infections • Neurodegenerative diseases • Plan therapy • Biopsy guidance • Aid in prognosis
Examples Normal brain Melanoma metastasis Lung metastasis Lung metastasis Grade 2 glioma Grade 2 glioma Grade 3 glioma Grade 3 glioma Grade 4 glioma Grade 4 glioma Grade 4 glioma Center of grade 4 glioma • Spectra from • normal brain tissue • brain metastases • necrosis • gliomas of different grades
Glioma Grade 2 Grade 3 Grade 4 Spectra w/ metabolic abnormalities shaded those w/ peaks corresponding to lactate or lipid marked with “∗”
Right Frontal Anaplastic Oligoastrocytoma Non-enhancing right frontal mass ElevatedrTBV compared w/ contralateral normal tissue increase decrease Post contrast T1-weighted Relative CBV NAA/Cr ratio Cho/Cr ratio
MR Microscopy Comparison of MR microscopy & conventional pathology sections
Uses • Pathology applications • Study models of disease, toxicology, effects of drug therapies • SNR↓ as voxel size↓ • Very high field required • Dedicated ultra-small coils • Clinical • Bone & joint imaging • Esp. hyaline cartilage
In vivo μMR in vivo MR microscopic image of human forearm skin acquired using a 1.5 T whole body imagerDepth resolution: 38 µm, measurement time: 7 min Patellar cartilage
Interventional MRI • Advantages • Intra-operative acquisition of images w/out moving patients • Image-guided stereotaxy w/out pre-op imaging • Real-time tracking of instruments • Precise location area under examination • Continual monitoring of procedure in 3D • Challenges • Expensive • Surgical instruments • Non-ferromagnetic • Produce minimum susceptibility artifacts • Anesthetic & monitoring equipment must be MR safe
Uses • Liver imaging & tumor ablation • Using laser therapy • Ablation via heat • Using cryotherapy • Ablation via extreme cold • MRI only technique that can discriminate different tissue temperatures • T1 & T2 temperature dependent • Interstitial Laser Therapy (ILT) • Laser energy delivered percutaneously to various depths in tissue • EPI used for real-time intraoperative assessment of heat distribution • Breast imaging & benign lump excision • Orthopedic & kinematic studies • Congenital hip dislocation manipulation & correction • Biopsies • Functional endoscopic sinus surgery