Download
1 / 8
80 likes | 181 Vues
a lkfos PCA. SPH 247 Statistical Analysis of Laboratory Data. > library( ISwR ) > data( alkfos ) > names( alkfos ) [1] " grp " "c0" "c3" "c6" "c9" "c12" "c18" " c24“ > summary( alkfos ) grp c0 c3 c6

E N D
alkfos PCA SPH 247 Statistical Analysis of Laboratory Data
> library(ISwR) > data(alkfos) > names(alkfos) [1] "grp" "c0" "c3" "c6" "c9" "c12" "c18" "c24“ > summary(alkfos) grp c0 c3 c6 Min. :1.000 Min. : 81.0 Min. : 79.0 Min. : 79.0 1st Qu.:1.000 1st Qu.:124.0 1st Qu.:110.0 1st Qu.:112.5 Median :1.000 Median :161.0 Median :134.0 Median :146.0 Mean :1.465 Mean :159.9 Mean :143.3 Mean :149.0 3rd Qu.:2.000 3rd Qu.:190.5 3rd Qu.:170.5 3rd Qu.:167.5 Max. :2.000 Max. :237.0 Max. :277.0 Max. :298.0 c9 c12 c18 c24 Min. : 74.0 Min. : 73.0 Min. : 69.0 Min. : 68.0 1st Qu.:107.5 1st Qu.:103.0 1st Qu.:114.0 1st Qu.:111.8 Median :140.5 Median :134.0 Median :140.0 Median :146.5 Mean :140.3 Mean :143.3 Mean :149.1 Mean :150.1 3rd Qu.:163.5 3rd Qu.:168.0 3rd Qu.:185.5 3rd Qu.:189.8 Max. :240.0 Max. :289.0 Max. :288.0 Max. :260.0 NA's : 1.0 NA's : 2.0 NA's : 4.0 NA's : 5.0 SPH 247 Statistical Analysis of Laboratory Data
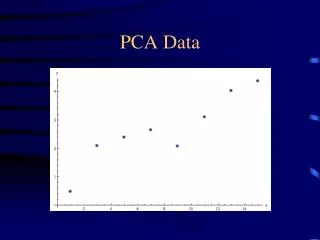
> af1 <- alkfos[complete.cases(alkfos),] > afmat <- af1[,-1] > grp <- af1$grp > pca.af <- prcomp(afmat,scale=T) > pca.tam <- prcomp(afmat[grp==2,],scale=T) > pca.placebo <- prcomp(afmat[grp==1,],scale=T) > plot(pca.af$x[,1:2],col=grp) > plot(pca.af) SPH 247 Statistical Analysis of Laboratory Data
> library(MASS) > lda.af <- lda(afmat,grp) > lda.af Prior probabilities of groups: 1 2 0.6 0.4 Group means: c0 c3 c6 c9 c12 c18 c24 1 156.7143 161.8571 173.9048 158.4286 163.8571 164.3333 163.2857 2 164.2143 125.1429 123.7143 118.7143 117.2857 130.7857 134.8571 Coefficients of linear discriminants: LD1 c0 0.0618073455 c3 -0.0329471378 c6 0.0004421163 c9 -0.0232320119 c12 -0.0248954902 c18 0.0113410946 c24 0.0003473940 SPH 247 Statistical Analysis of Laboratory Data
> af.pred<- predict(lda.af) > table(af.pred$class,grp) grp 1 2 1 20 0 2 1 14 > plot(grp,af.pred$x) SPH 247 Statistical Analysis of Laboratory Data