Download
1 / 16
160 likes | 325 Vues
Impact of global warming on tropical cyclone structure change with a 20-km-mesh high-resolution global model. A208. Hiroyuki Murakami (AESTO/MRI, Japan) Akio Kitoh (MRI, Japan). AMS Annual Conference 2009. ・ Evaluating changes in tropical cyclone size and structure influenced

E N D
Impact of global warming on tropical cyclone structure change with a 20-km-mesh high-resolution global model A208 Hiroyuki Murakami (AESTO/MRI, Japan) Akio Kitoh (MRI, Japan) AMS Annual Conference 2009
・Evaluating changes in tropical cyclone size and structure influenced by the global warming is important for projecting socioeconomic damage in the future. Motivation and Review ・However, conducting multi-year climate simulations in order to evaluate these changes costs huge computer resources. ・Most studies use regional model for climate projection. ・Knutson and Tuleya (1999, Climate Dynamics) =>The 51 tropical cyclones (hereafter TCs) experiments with an 18-km- mesh RCM are conducted over the western North Pacific. =>The warm core of the TC shifts upward under the warmed environment. =>The mean horizontal radius of the hurricane-force winds increases 2-3%. ・Jiang and Perrie(2007, Journal of Climate) =>A 25-year projection of future environment over North Atlantic is conducted with a 25-km-mesh RCM. =>A large increase in wind speed in the upper-level troposphere of the right portion of the storm center is detected. We used a 20-km-mesh Atmospheric Global Circulation Model in order to evaluate possible changes in tropical cyclone structure affected by global warming.
MRI/JMA Atmospheric GCM Based on operational JMA-GSM Resolution: TL959(20km) with 60 layers Time integration: Semi-Lagrangian Scheme (Yoshimura, 2004) 2 days/1 year integration with DT=6 min and 30 nodes of Earth Simulator (ES has total 640 nodes) Physics Cumulus convection: Prognostic Arakawa-Schubert (Randall and Pan, 1993) SW radiation: Shibata & Uchiyama (1992) LW radiation: Shibata & Aoki (1989) Land hydrology: MJ-SiB: SiB with 4 soil-layers and 3 snow-layers Clouds: large-scale condensation, Cumulus, stratocumulus PBL: Mellor & Yamada (1974,1982) level-2 closure model Gravity wave drag: Iwasaki et al. (1989) + Rayleigh friction Japan Meteorological Agency (JMA) :Operational global NWP model from Nov 2007 Meteorological Research Institute (MRI) : Next generation climate model
Experimental Design for Climate Simulations; Time-Slice Experiment High-Resolution Global Atmospheric Model Atmosphere-Ocean model 270-180km mesh AGCM 20kmmesh CMIP3 ensemble mean Predicted SST Atmo sphere Atmo sphere SST SST Ocean Boundary condition Future Near Future 200-50km mesh OGCM Present SST 4 SST=Sea Surface Temperature Year 1979-2003 2015-2039 2075-2099
How to determine SST Mizuta et.al (2008) CMPI3 ensemble mean SST under the A1B Scenario Experiment Present SST Observed SST 1979~2003 ΔSST AR4_20thCentury Exp. SST-2001 • 2003 2075 2099 25 years 25 years Future SSTA also applies for 2015-2039 CMIP3 SST change CMIP3 SST Trend 2075-2099 Inter-annual variability of Observed SST 1979-2003 + = + ΔSST Mean SST(2075-2099) – Mean SST(1979-2003)
Methodology -Composite Analysis Composites here are defined as the average maximum intensity of all storm center’s studies Sample of composition grids Total TC number (annual average) Present-day :2086 (82) Future :1667 (66)
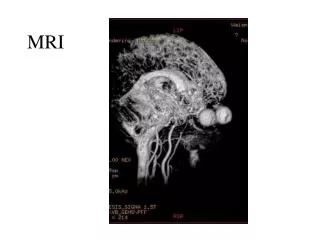
Sample of simulated tropical cyclone (Infrared image by model outputs) Model (hypothetical) GMS (observation) Infrared image 2003 08 07 12 Initial FT=36
Wind speed in knot Radial Profile around Tropical Cyclone (Surface Wind) Wind Profile Change(surface wind) Radial Distance in km from Storm Center ・Large changes in wind velocity occur near inner-coreregion. ・A surface wind speed increase of more than 4% can be seen up to 500 km from storm center.
unit:m/s Change in tangential component of wind (distance and vertical section) Vertical pressure level Distance from center ・The larger increase in tangential wind occurs at mid level of troposphere. ・The large increase in wind velocity (12-15% )occursat the inner-core side. #gray color=no significant difference
unit:K Change in temperature anomaly (distance vs vertical) Vertical pressure level Distance from center ・ The largerincrease intemperatureanomalycan be seen in the vicinity of a center core at the upper troposphere. (Same as Knutson and Tuleya (1999)) #gray color=no significant difference
Present Experiment Future Experiment Precipitation Change Change from Present to Future Distance from center (km) Changing ratio (%) azimuthal angle unit:mm/day At most a 50% increase in precipitation can be identified in the region up to 100 km from the center. #gray color=no significant difference
Consecutive 25-year climate simulations using a 20-km-mesh high-resolution AGCM were conducted to explore structural changes in tropical cyclones due to global warming. Simulations were conducted for both a present-day and a future warmed environment which is based on an A1B scenario. Summary ・More than a 4% increase in surface wind velocity was identified up to 500 km from storm centers. ・An increase in wind velocity was the larger at the middle level of troposphere. ・At most a 50% increase in precipitation was identified in the inner-core region of the TC (at less than 100 km from the center). ・Warm-core enhancement at the upper troposphere leads to an increase in vertical level of TCs.
Number of TC Generated in Each Latitude Annual global average Present =82 Future =66 Observation Present-day(25yr) Future(25yr) (20% decrease) TC freqency Latitude
Shift in TC Generated Position Averaged TC generated position (present-day simulation) Generated position for each TC (present-day simulation) Averaged TC generated position (future simulation) Generated position for each TC (future simulation)