MRI
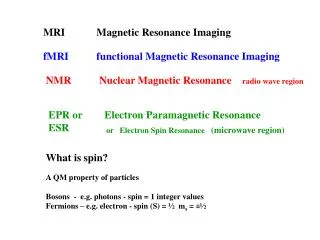
MRI. Magnetic Resonance Imaging. fMRI. functional Magnetic Resonance Imaging. NMR. Nuclear Magnetic Resonance radio wave region. EPR or ESR. Electron Paramagnetic Resonance or Electron Spin Resonance (microwave region) . What is spin? . A QM property of particles

MRI
E N D
Presentation Transcript
MRI Magnetic Resonance Imaging fMRI functional Magnetic Resonance Imaging NMR Nuclear Magnetic Resonance radio wave region EPR or ESR Electron Paramagnetic Resonance or Electron Spin Resonance(microwave region) What is spin? A QM property of particles Bosons - e.g. photons - spin = 1 integer values Fermions – e.g. electron - spin (S) = ½ ms = ±½
Paramagnetic (unpaired electrons) vs. Diamagnetic (no unpaired electrons) If an atom, ion, or molecule is paramagnetic the energy levels of the opposite spins of the unpaired electron are the same (degenerate) However, if the atom, ion, or molecule is exposed to a magnetic field (B0) the energy levels split and one spin is favored over the other. NMR }DE DE is influenced by proton environment due to shielding of magnetic field DB = -sB B0 →
Spectroscopy High Energy – shorter wavelength Low Energy - longer wavelength Population and Boltzman distribution Nes/Ngs = exp(-DE/kT)
1D NMR – magnetic field is constant – vary emrn, at E = hn = DE the nucleus will absorb emr resulting in NMR spectra. The chemical shift (relative value of n) and splitting pattern is dependent on the chemical environment of the proton. 2D NMR – Main magnetic field is constant (B0) A 2nd magnetic field (B1) ┴ to (B0) Relaxation time – fraction of time required after pulse for nuclear spins to return to their original equilibrium distribution values. Boltzman Distribution Function N2/N1 = e-DE/kT. NOE – Nuclear Overhauser Effect – Through space interactions that influence the relaxation time of neighboring protons. Used for 2D NMR structure determination of proteins.
fMRI A techniques that monitors the NMR signal of water in a specific area of the brain – 64 MHz with 1.5T instrument The water signal is influenced by the Fe center of Hemoglobin deoyHb is paramagnetic and shifts the water signal. Since the signal is spread out over a greater n range the spectrum records this as a reduction in signal intensity relative to oxyHb.
BOLD Blood Oxygen Flow Dependence Baseline brain activity = normal blood flow Active areas of brain ↑metabolic activity This causes ↑glucose metabolism and ↑O2 release and ↑[deoxyHb] Body responds by increasing blood flow to area for 4-5s – mechanism ? ↑blood volume = ↑(oxyHb/deoxyHb) = ↑(H2O NMR signal)
Control – no cognitive activity NMR signal intensity Noise or normal fluctuations in signal intensity time Increase in oxyHb due to blood flow (BOLD) Blood Oxygen Flow Dependence NMR signal intensity 4-5s Increase in deoxyHb Cognitive activity in specific brain area time
fMRI experiment Place subject in MRI machine Establish baseline blood flow/NMR signal for selected brain areas Introduce task to encourage thought etc. Ask questions – look at pictures – listen to sounds/music etc. Measure change in MRI signal in select brain areas (include control area) Repeat to ensure results are statistically significant (controversial?) Draw conclusions suggesting which areas of brain are involved in task. (and which aren’t)
Can fMRI detect AD prior to typical symptoms? AD begins long before symptoms are apparent. Deficiencies in memory may signal AD. Woodard Study 78 subjects: median age = 74 Risk factors tracked …. Hippocampus Size (HCV) apoE4 allelle (aE4) fMRI memory task (fMRI) Cognitive assessment: at time = 0 and time = 18 months read list of names: Famous or Not famous monitor cortex and hippocampus (memory storage and retrieval? Stable Group: ↑fMRI response to famous names & ↓unfamiliar Declining Group: opposite change not test result but change in fMRI responses that cued diagnosis. Conclusions: HCV (69%) aE4 (62%) chance (50%) aE4 + fMRI (79%) aE4 + HCV (70%) all three (79%)
Can Resting State fMRI provide biomarker for AD? Jessica Damoiseaux commentary Functional Brain Connectivity vs. Structural Brain Changes # dendrite connections? vs. Size/#cells? Groups: 1) Normal aging 2) mild cognitive impairment 3) AD onset Results: 3) ↓functional connectivity in pesterior network region ↑functional connectivity in frontal mode regions hyper connectivity …. Compensatory mechanism for loss of function elsewhere? Precedes hypo-connectivity Problems: age-related decline vs. AD? Individual differences vary considerably. Is data meaningful? Conclusions: Need technique improvements Study individual over time vs. comparison to norm.